MIDDELGRUNDEN

Overview
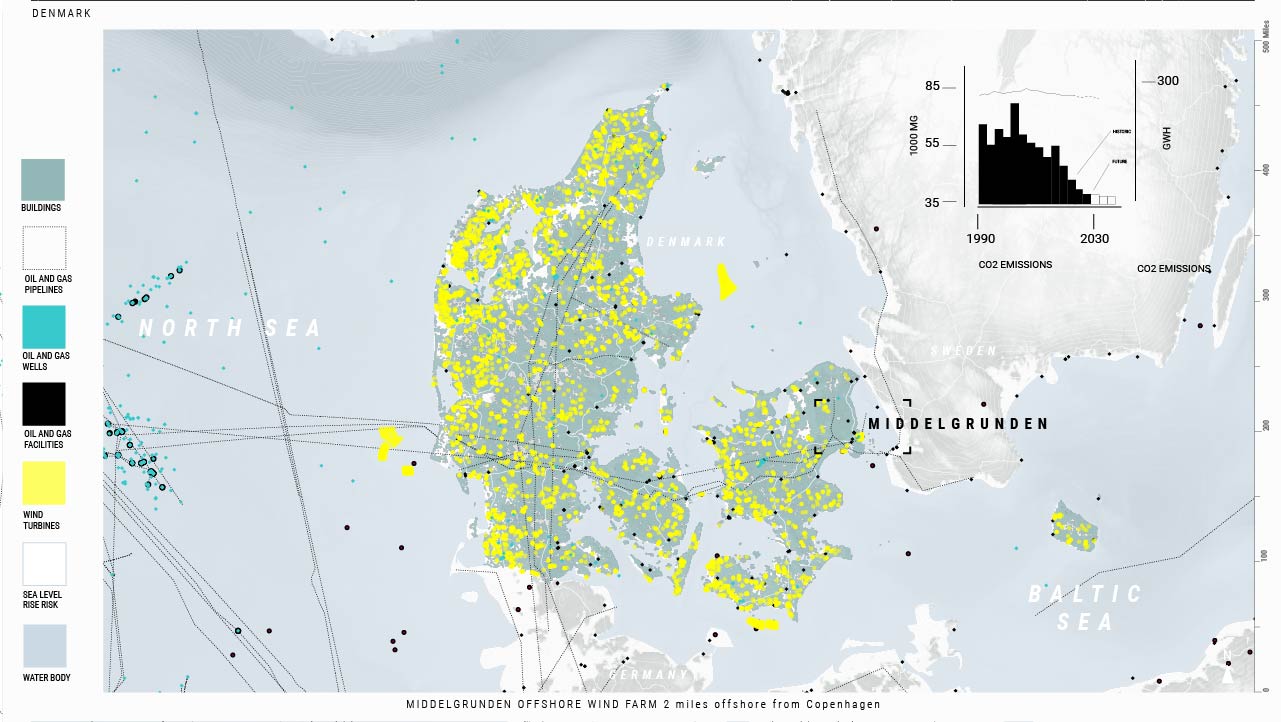
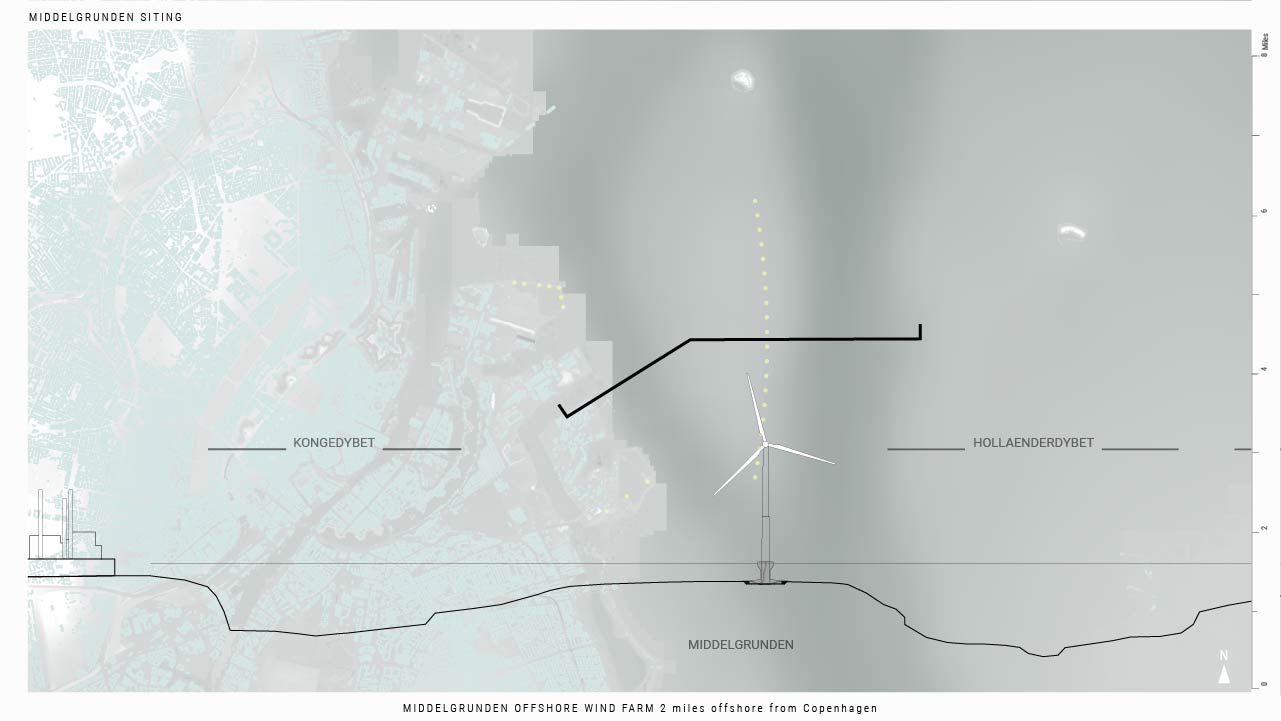
Middelgrunden Wind Farm is located off the shore of Copenhagen, Denmark. At the time that it was built in 2000, it quickly became known as the largest offshore wind in the world with 20 turbines and spanning about 2.18 linear miles. The subtle arc of the wind turbines that seems to hug the shoreline is iconic and has attracted many visitors, especially in its early years. The turbines provide energy for thousands of households in Copenhagen thus reducing demand for other traditional nonrenewable energy sources. Public cooperation was crucial, and continues to be crucial in more recent wind farm projects, due to increasing opposition. This resistance tends to arise from concerns about noise, aesthetics, and impact on marine life and birds.
More recently, now that some of the turbines are nearing their end of life, there are pilot projects to recycle and restore the turbines in order to extend the lifespan of the turbines at the Middelgrunden wind farm.
More recently, now that some of the turbines are nearing their end of life, there are pilot projects to recycle and restore the turbines in order to extend the lifespan of the turbines at the Middelgrunden wind farm.
Organizations/Collaborators
• Copenhagen Environment and Energy Office
• Københavns Energi (Copenhagen Energy)
• Middelgrundens Vindmøllelaug (Middelgrunden Wind Energy Collective)
• SEAS Wind Energy Centre
• Københavns Energi (Copenhagen Energy)
• Middelgrundens Vindmøllelaug (Middelgrunden Wind Energy Collective)
• SEAS Wind Energy Centre
• Danish Energy Agency
Key Terms
MAP
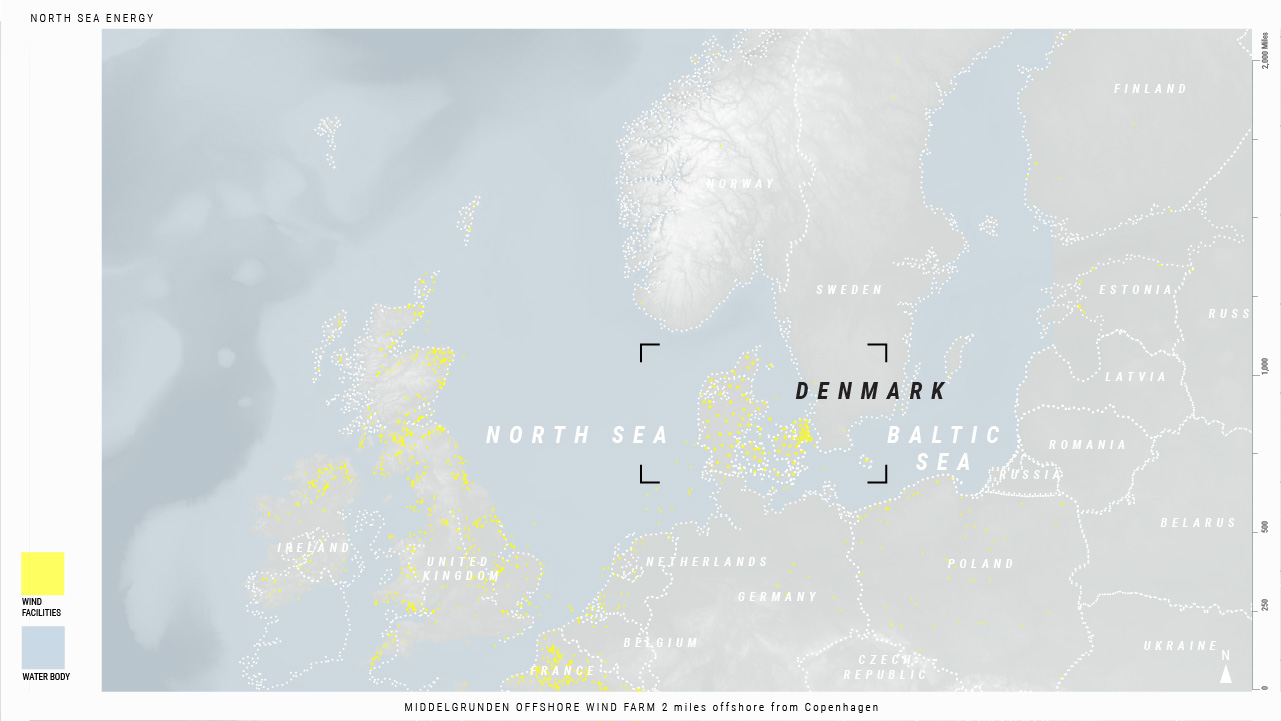
RENEWABLES: BIOMASS, GEOTHERMAL, HYDRO, SOLAR, TIDAL, WIND
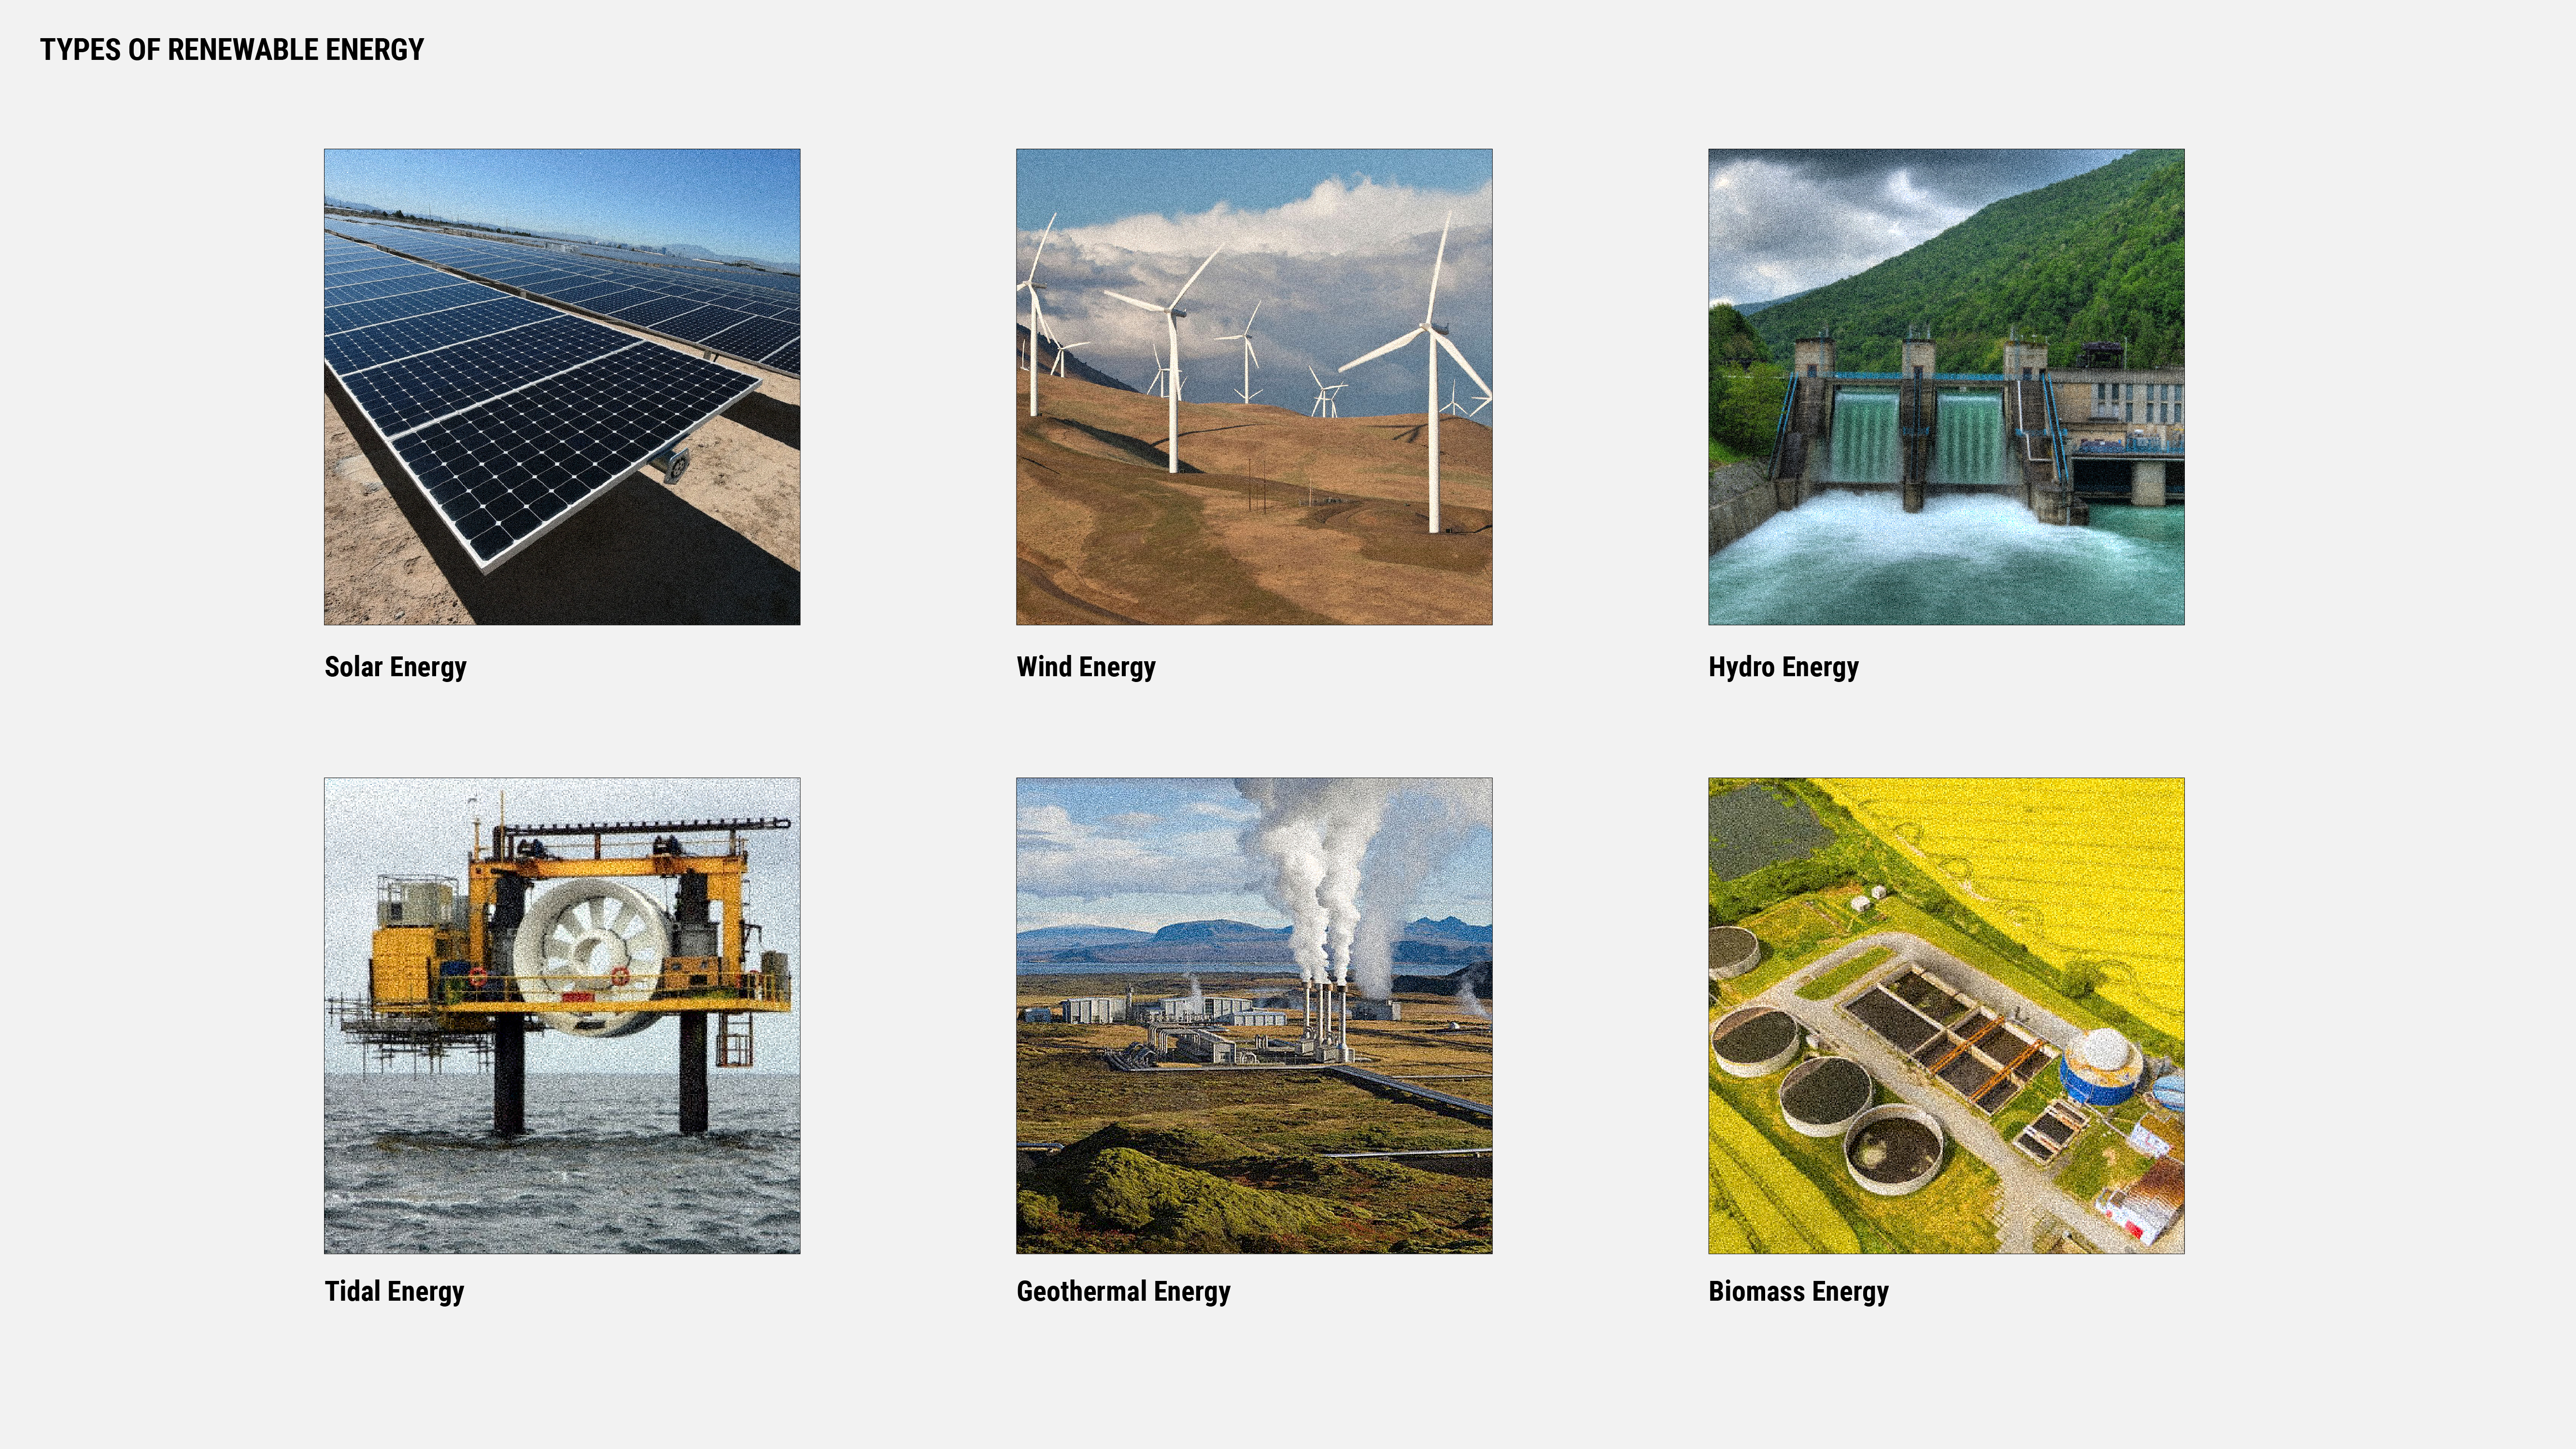


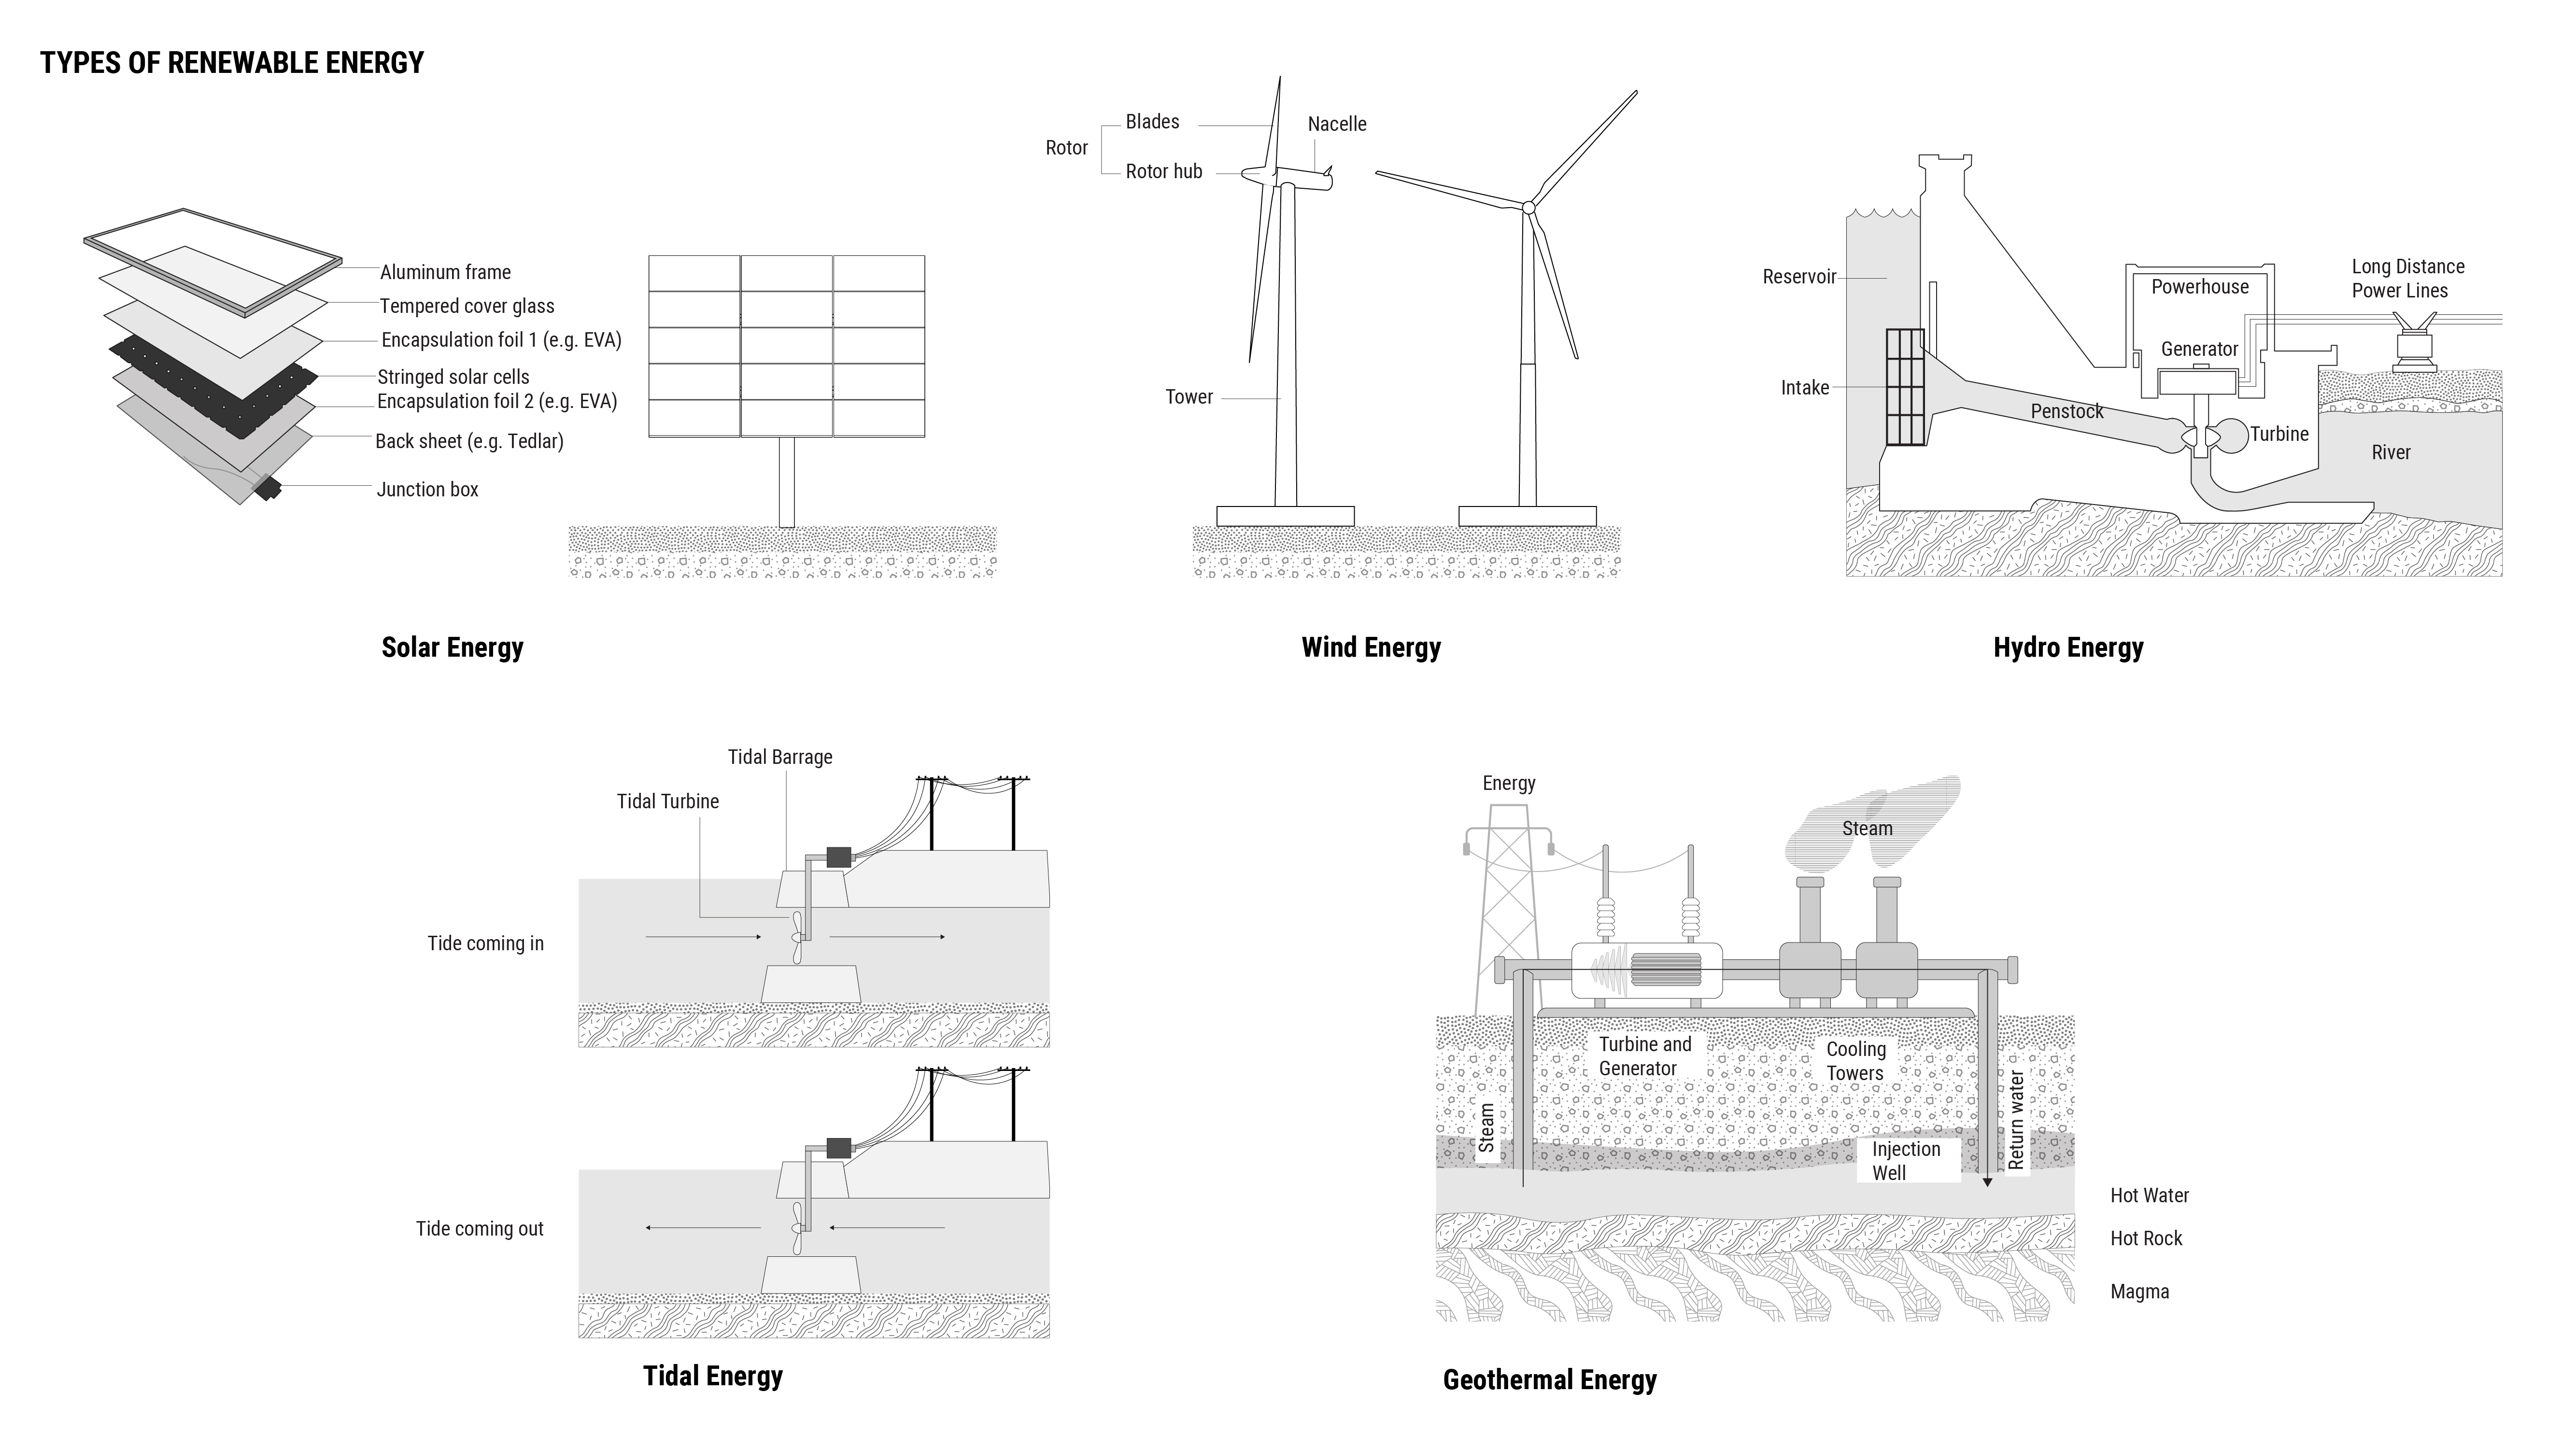
Renewable energy is generally defined as energy that comes from resources that are spontaneously replenished but are flow-limited. These resources are inexhaustible over a long time-scale, but are limited in the amount of energy that is available in shorter units of time. Wind energy, for example, is inexhaustible over millions of years, but there is a limited amount of wind each minute, hour or day. There are six main categories of renewable energy: biomass, hydro, geothermal, solar, tidal, and wind.
Biomass is a broadly defined category for renewable organic material from plant and animal sources, including wood and wood processing wastes, agricultural crops like soybeans, algae and corn, waste materials like food processing residues, municipal solid waste, as well as animal and human manure. Biomass is converted into energy through a variety of processes, the most common of which is direct combustion, or burning to produce heat. Biomass was the largest source of US energy production until the mid-1800s, and is still an important source of fuel in many countries around the world.
Geothermal energy is generated from the heat that is emitted through the radioactive decay of materials in the earth’s core. The temperature difference between the earth’s core, which is roughly 10,800°F, and the earth’s surface, drive geothermal power production. Geothermal plants use steam to produce electricity from reservoirs of hot water miles beneath the earth’s surface. The steam rotates turbines that activate generators, producing electricity.
Hydropower is produced from moving water. Hydropower is a technology that has scaled across time, from water wheels used to power grain and lumber mills to massive hydroelectric projects like the Hoover Dam. Hydropower was the largest form of renewable energy in the United States until 2019, with 1,450 plants across the United States. The key requirement of any kind of hydropower generation, at any scale, is for the power plant to be located on or near a water source. The volume of water flow and the change in elevation determine the amount of energy available in moving water. Most hydroelectric facilities are either run-of-the-river systems, in which the force of a current applies pressure on a turbine, or storage systems, where water accumulates in reservoirs behind dams and are released through turbines to generate electricity when needed. While hydroelectric facilities are generally small, they dramatically alter landscapes, often at the scale of the territory for large-scale dam infrastructure projects. The environmental impacts of hydropower have created a debate as to whether hydropower is a true source of renewable energy. In US states with renewable portfolio standards that require utilities to generate a percentage of their power from renewable sources, hydropower does not count toward the mandate.
Solar thermal energy systems convert sunlight into solar thermal heat. Solar ovens were developed in the early 19th century, and the technology has since evolved with solar photovoltaic (PV) systems that directly convert sunlight into electricity. PV systems range from the very small, including calculator and watch systems, to the very large, in massive solar arrays with multiple panels that can power thousands of homes and businesses. Solar systems require a large surface area to absorb sunlight, and consistent sunlight conditions, which varies based on latitude, season and the time of day.
Wind power relies on the daily wind cycle, as air above terrestrial ecosystems heats more quickly than air above aquatic ecosystems. Wind is used to generate electricity through turbines with blades that turn around a rotor that spins a generator to produce electricity. To generate electricity, wind turbines need a consistent source of wind. Both wind and solar power generation require batteries or other storage devices to retain electricity from peak generation times to send to the electrical grid during peak demand times.
These six renewable energy sources have used different technologies at different points in time, and will continue to evolve and be deployed across the globe.
POLICY COMPARISONS
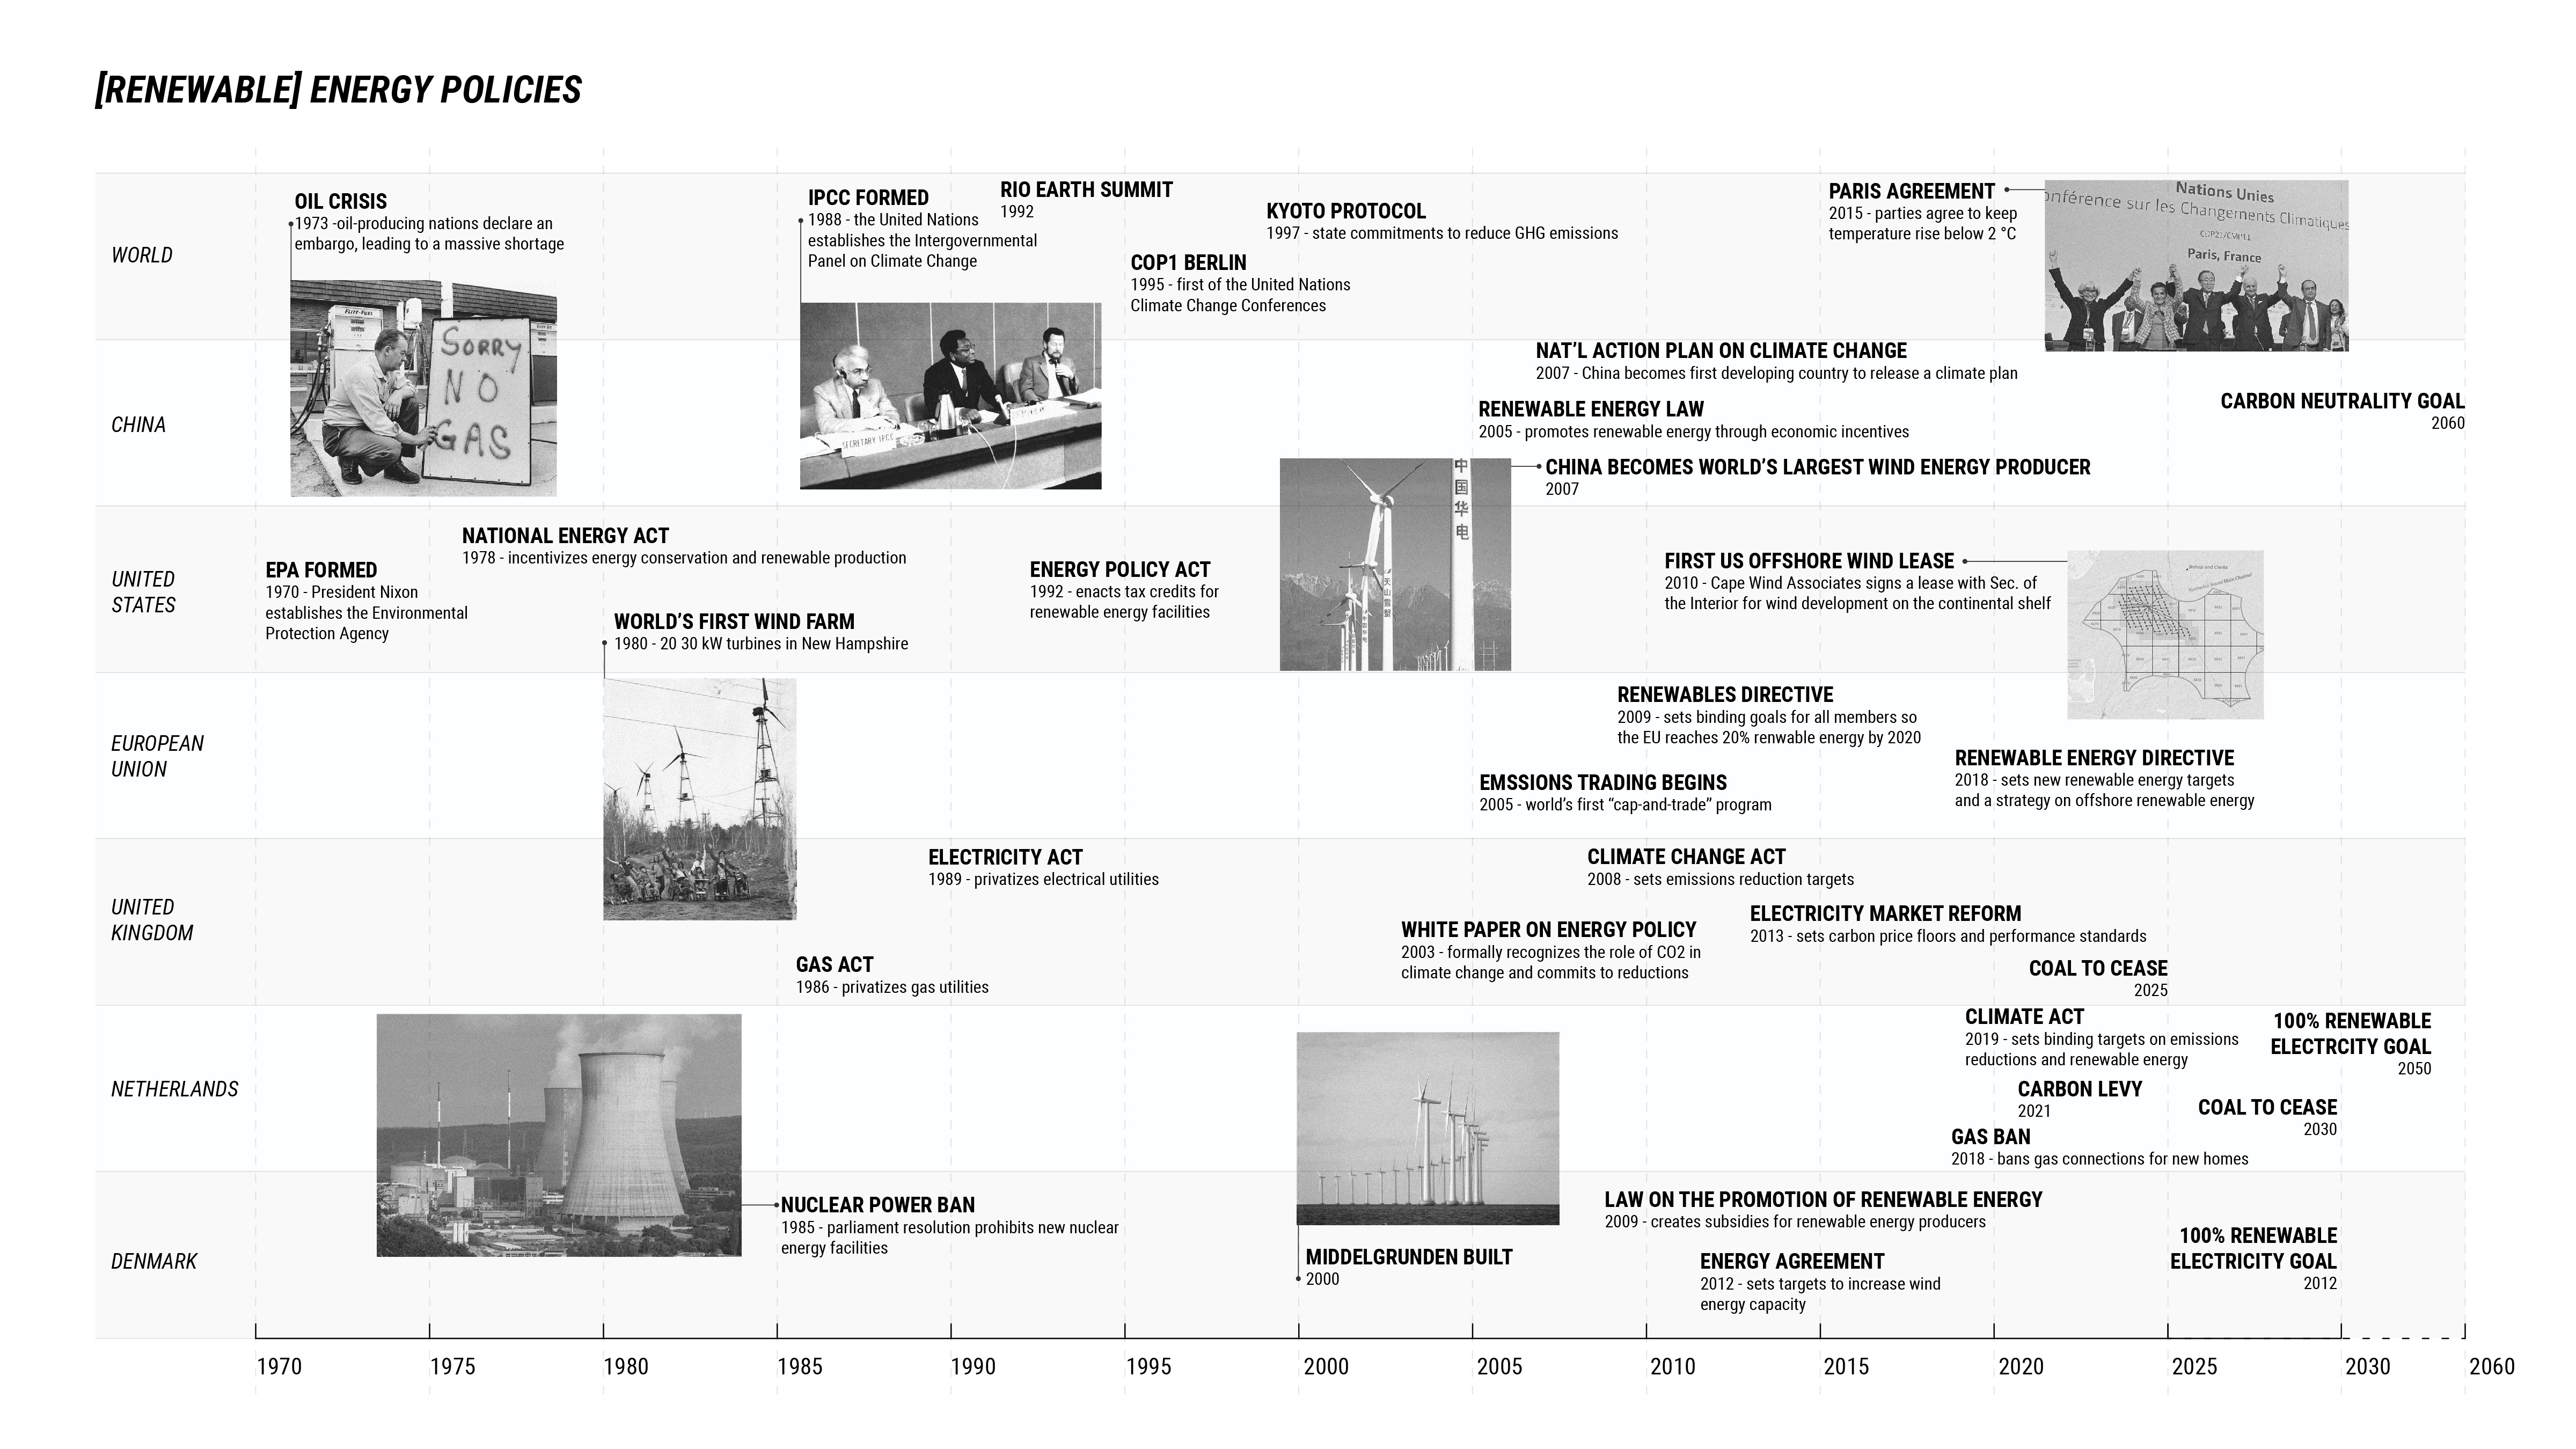
The Protocol recognized climate change as a global collective action problem in which individual countries have different capabilities and responsibilities for combating climate change due to economic development. The Protocol separated countries into Annex I and non-Annex I countries. Annex I countries are industrialized nations, including most European nations, Australia and Kazakhstan. Annex I countries committed themselves to legally binding targets to reduce six target greenhouse gas emissions: carbon dioxide, methane, nitrous oxide, sulphur hexafluoride, hydrofluorocarbons and perfluorocarbons. These countries committed to reducing their emissions based on a baseline year, which was generally accepted as 1990. Non-Annex I countries did not have legally binding targets, and countries that signed but did not ratify the Protocol (including the United States) were not legally bound to meet the emissions reductions target. The Kyoto Protocol only regulated greenhouse gas reductions between 2008 to 2012. It was extended until 2020 with the Doha Amendment in 2012, but replaced by the Paris Agreement, which was adopted by the United Nations in 2015.
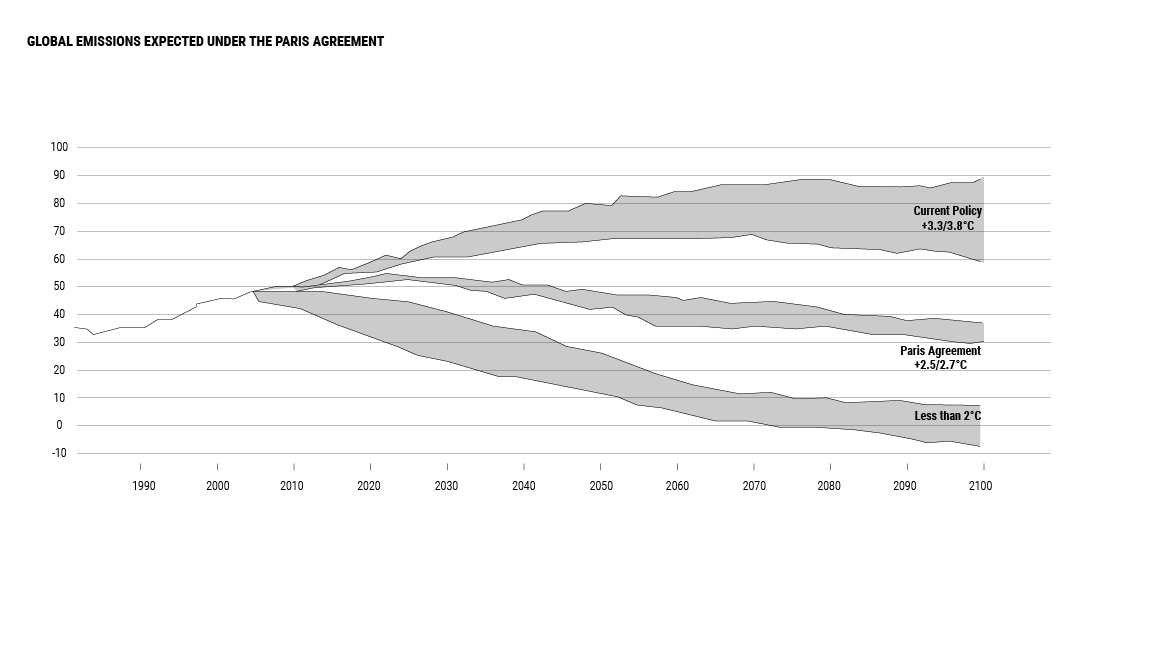
The goals of the Paris Agreement are similar to the Kyoto Protocol. Namely, the agreement will limit greenhouse gas emissions to 2 degrees Celsius above pre-industrial levels, and increase the ability of nations to adapt to climate change and make financial flows consistent with a pathway toward low greenhouse gases and emissions.
Within the overarching structure of the Paris Agreement, each nation is responsible for reducing their own emissions through domestic policies.
In the United States, renewable energy policies have been passed at both the federal and state levels. The federal government must consume 7.5% of its total electricity from renewable sources. In addition, the federal government provides various tax credits and loans to drive conversion. For states, there are renewable portfolio standards (RPS) that require electric utilities and providers to provide a specified amount of electricity from renewable sources. There is also a Public Benefits Fund for renewable energy that is used by state governments to invest in clean energy supply projects. These funds are generated through systems benefits charges on customer’s electricity rates. The Environmental Protection Agency (EPA) has established output-based environmental regulations that establish emissions limits for different types of energy production to encourage renewable energy as an air pollution control standard. Net metering policies allow residential and commercial customers who generate their own renewable electricity to receive compensation for that electricity. Individual states also have their own additional policies. In 2020, renewable energy sources accounted for 12% of total US energy production, and 20% of electricity generation.
The US renewable energy transition lags behind China, which produces 26% of its electricity generation from renewables. China’s renewable energy conversion is driven by several national policies. The 2005 Renewable Energy Law emphasizes the development and use of renewable energy from hydro, wind, solar and geothermal sources. Various other legislative initiatives, including the Plan for the Prevention and Control of Air Pollution, call for a renewable energy transition. In addition to the Renewable Energy Law, China’s five year plans emphasize producing renewable energy. The five year plans are the socio-economic initiatives issued by the Chinese Communist Party every five years. The 14th Five-Year Plan, released in 2021, calls for increasing hydropower across the country, which is counted as a renewable energy source in the nation. China, given its governance structure and industrializing status, has the potential to play a significant role in future decarbonization.
Across Europe, which is commonly hailed as a leader in the transition to renewable energy, Holland is an outlier. The Netherlands produces less than 10% of its total energy from renewables, less than all 27 of the other European Union (EU) countries.The topography of the Netherlands, which is mostly flat, limits the amount of hydropower resources, so the country has focused on using biomass as a source of renewables. Each EU country was required to submit a National Renewable Energy Action Plan in 2010 to meet the Renewable Energy Directive targets by 2021. Across the European Union bloc, the target was to produce 20% of the EU’s total energy from renewables.
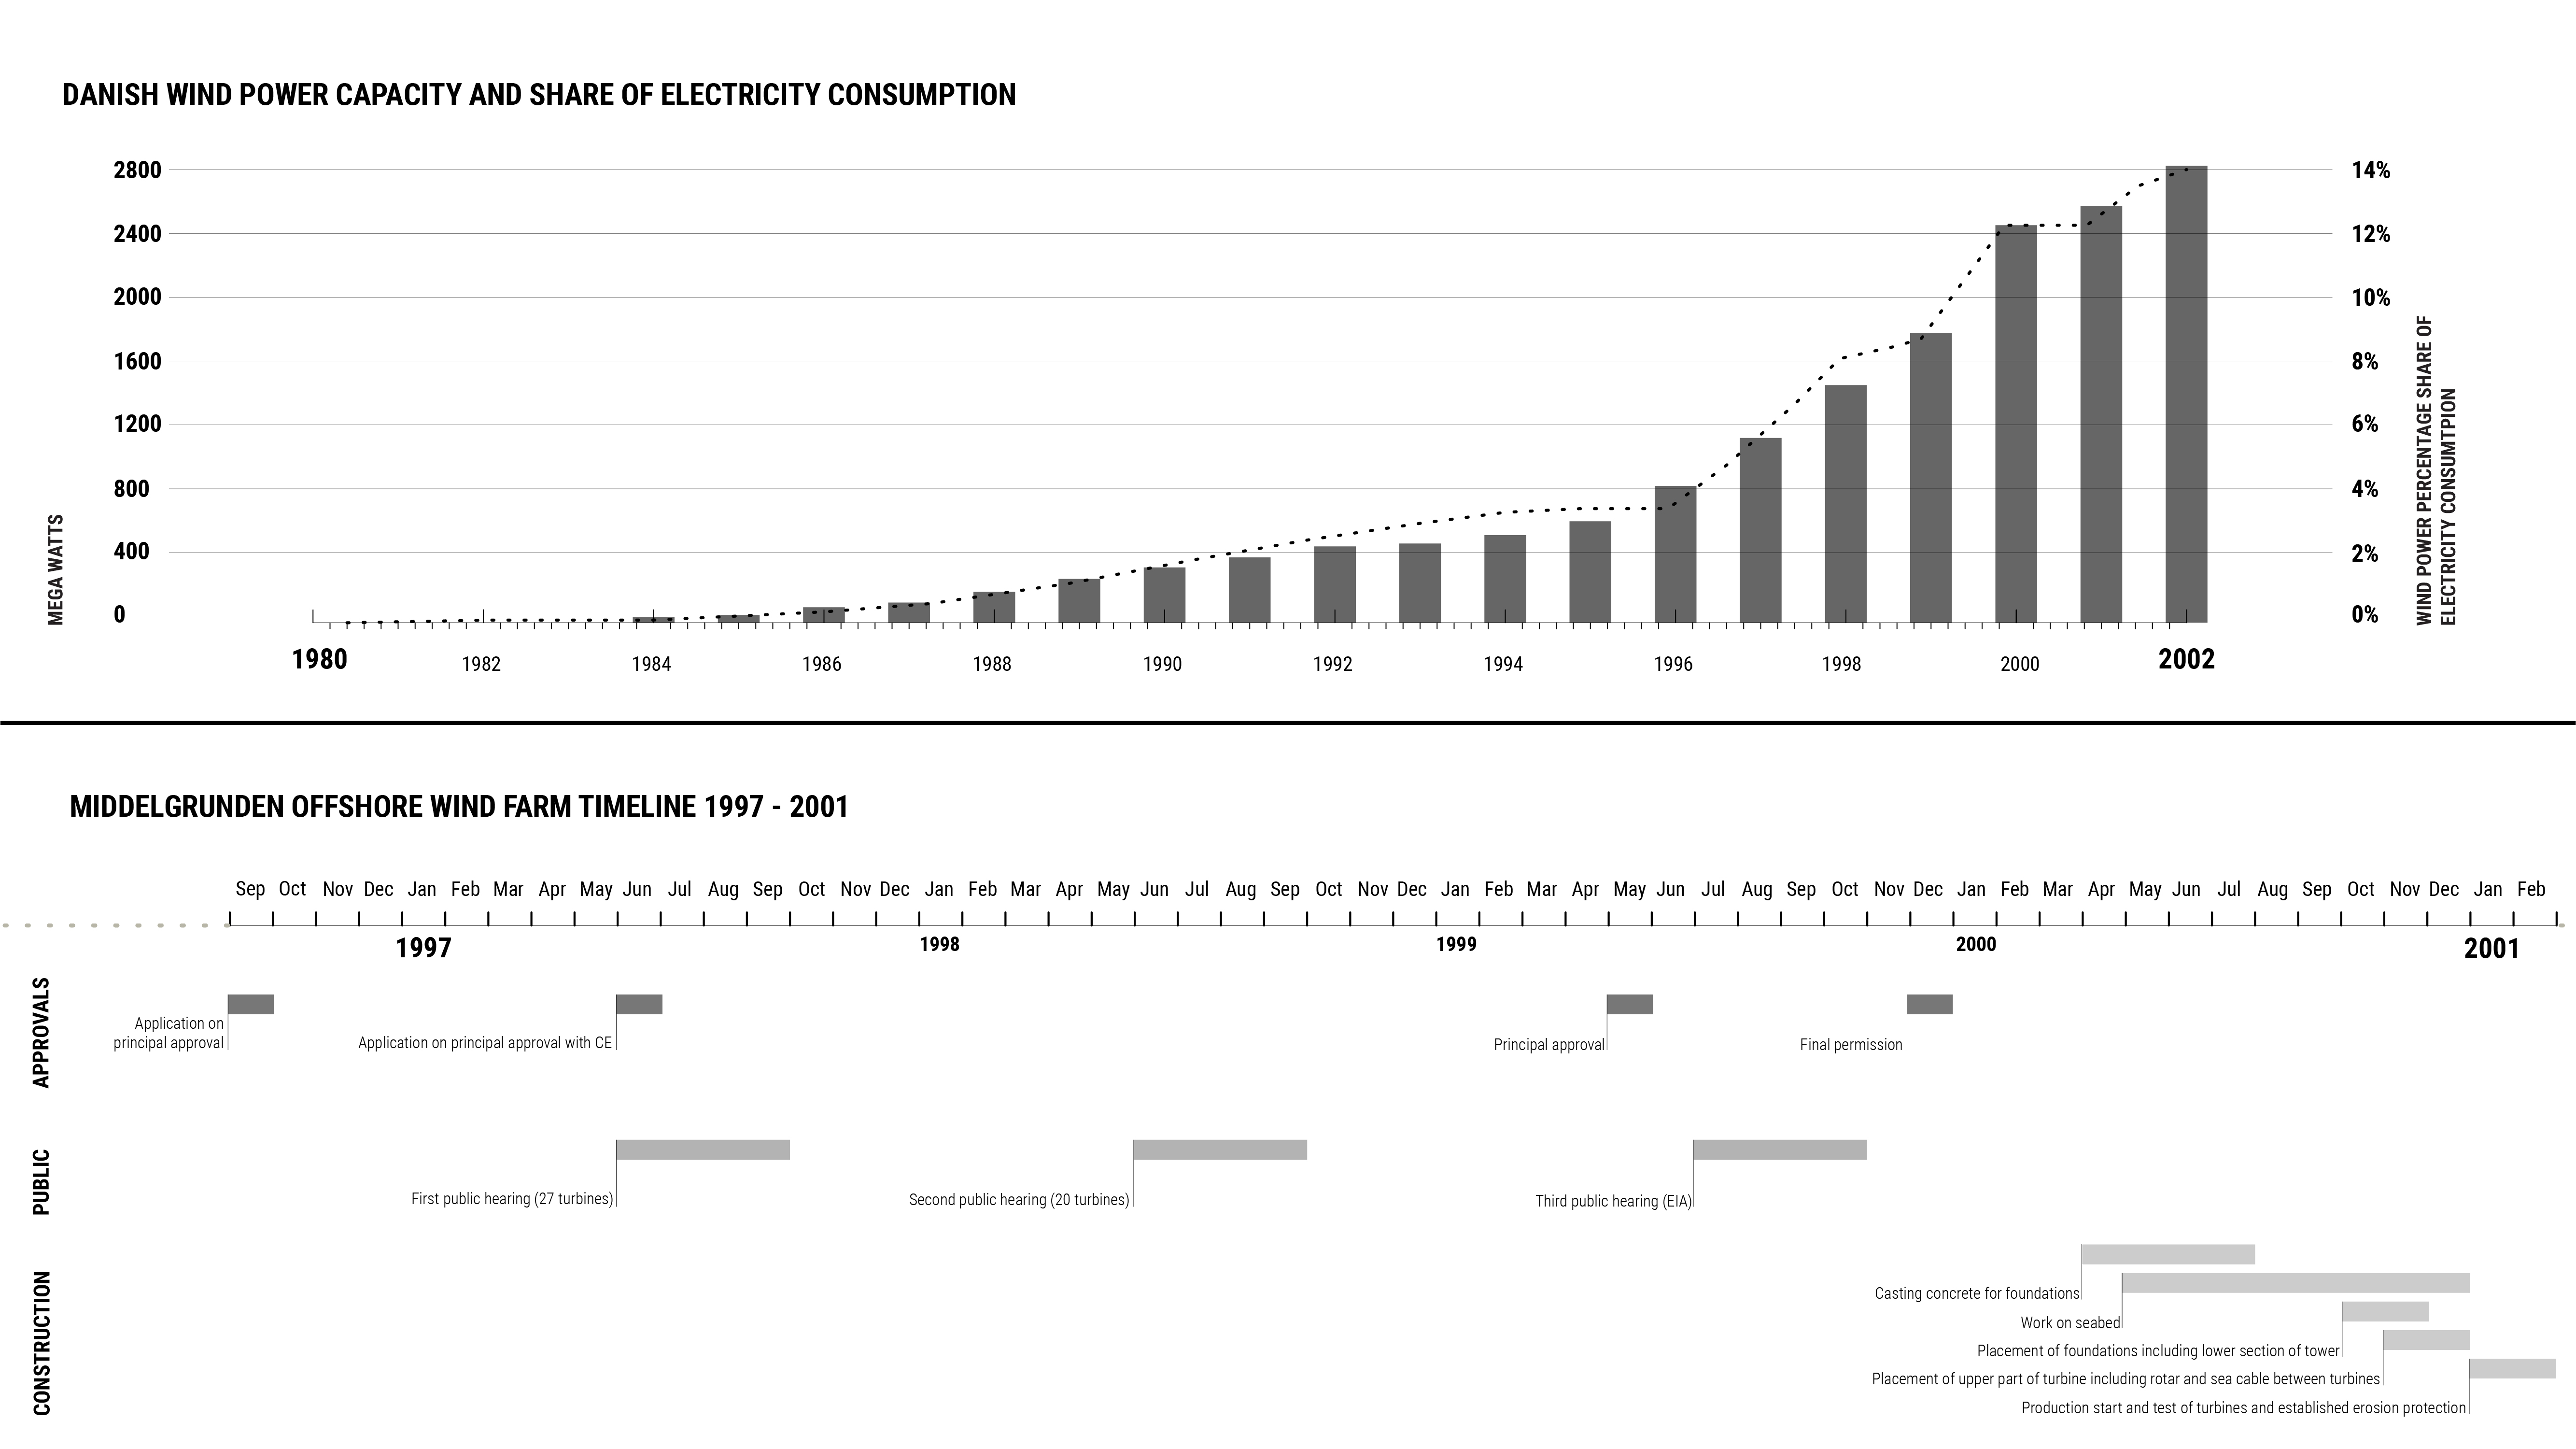
The Energy Directive targets were mutually dependent, meaning that Holland’s lagging transition was compensated for in part by Denmark’s renewable energy production. In 2020, Denmark produced 30% of its total energy from renewables, including 47% of the nation’s electricity consumption from wind power alone. The Danish government subsidizes research on renewable energy, and prompts renewable production through net metering and premium tariffs, which pay for renewable energy at a pre-set established price that is higher than market rates.
Similar to Denmark, the United Kingdom produces roughly 30% of its energy from renewable sources, primarily onshore wind. Scotland produces the majority of the Kingdom’s renewable energy, and exports 28% of its capacity to other countries across the United Kingdom.
The Danish and United Kingdom’s conversion to renewable energy shows the need for governments to drive producer and consumer interests toward green technology by adopting new technologies early, creating long-term policies to assure there are investors in renewable projects, and customizing policies for different types of technology and energy.
IMPLICATIONS: MATERIAL ECOLOGIES AND ECONOMIES

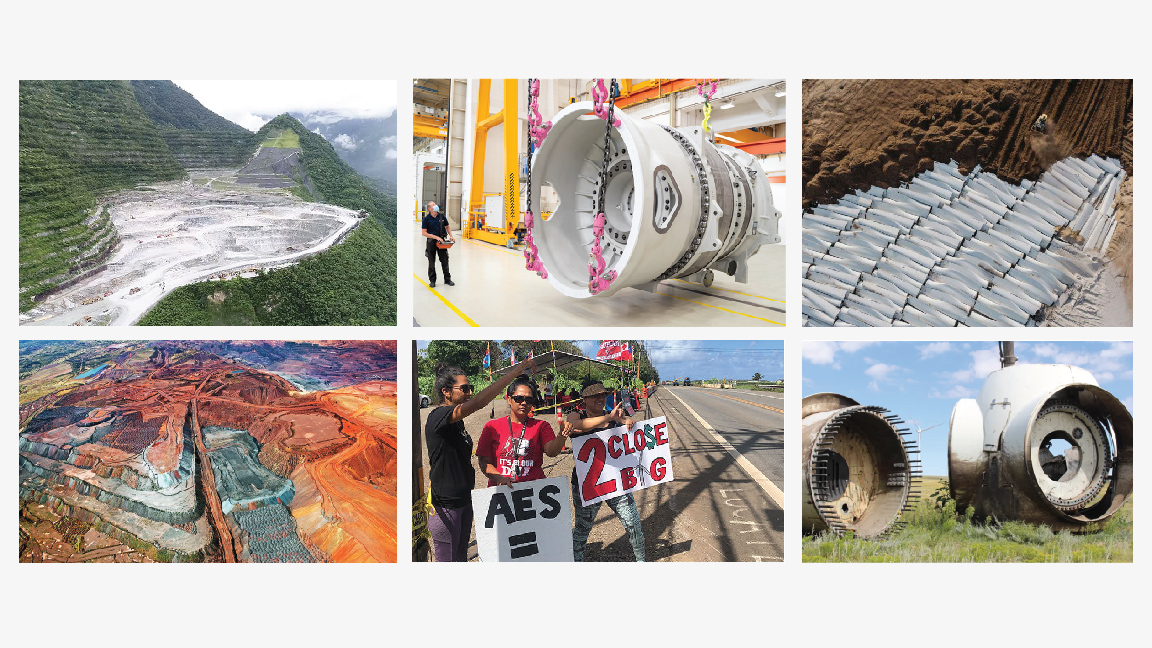
Steel produced from open pit iron ore mining, plastic from natural gas rigs and cement from limestone mines are transported across the globe using heavy machinery that runs on diesel, and manufactured in carbon-intensive processes. While well-sited and well-built wind turbines generate their embodied energy in a year, the production, installation and maintenance of turbines remain tied to fossil fuel energies.
The current lifespan of a turbine is just over 20 years before they are decommissioned. There are few options to recycle or trash turbine blades, which are very difficult to transport or recycle due to their massive size.
ENERGY FUTURES: THE NORTH SEA


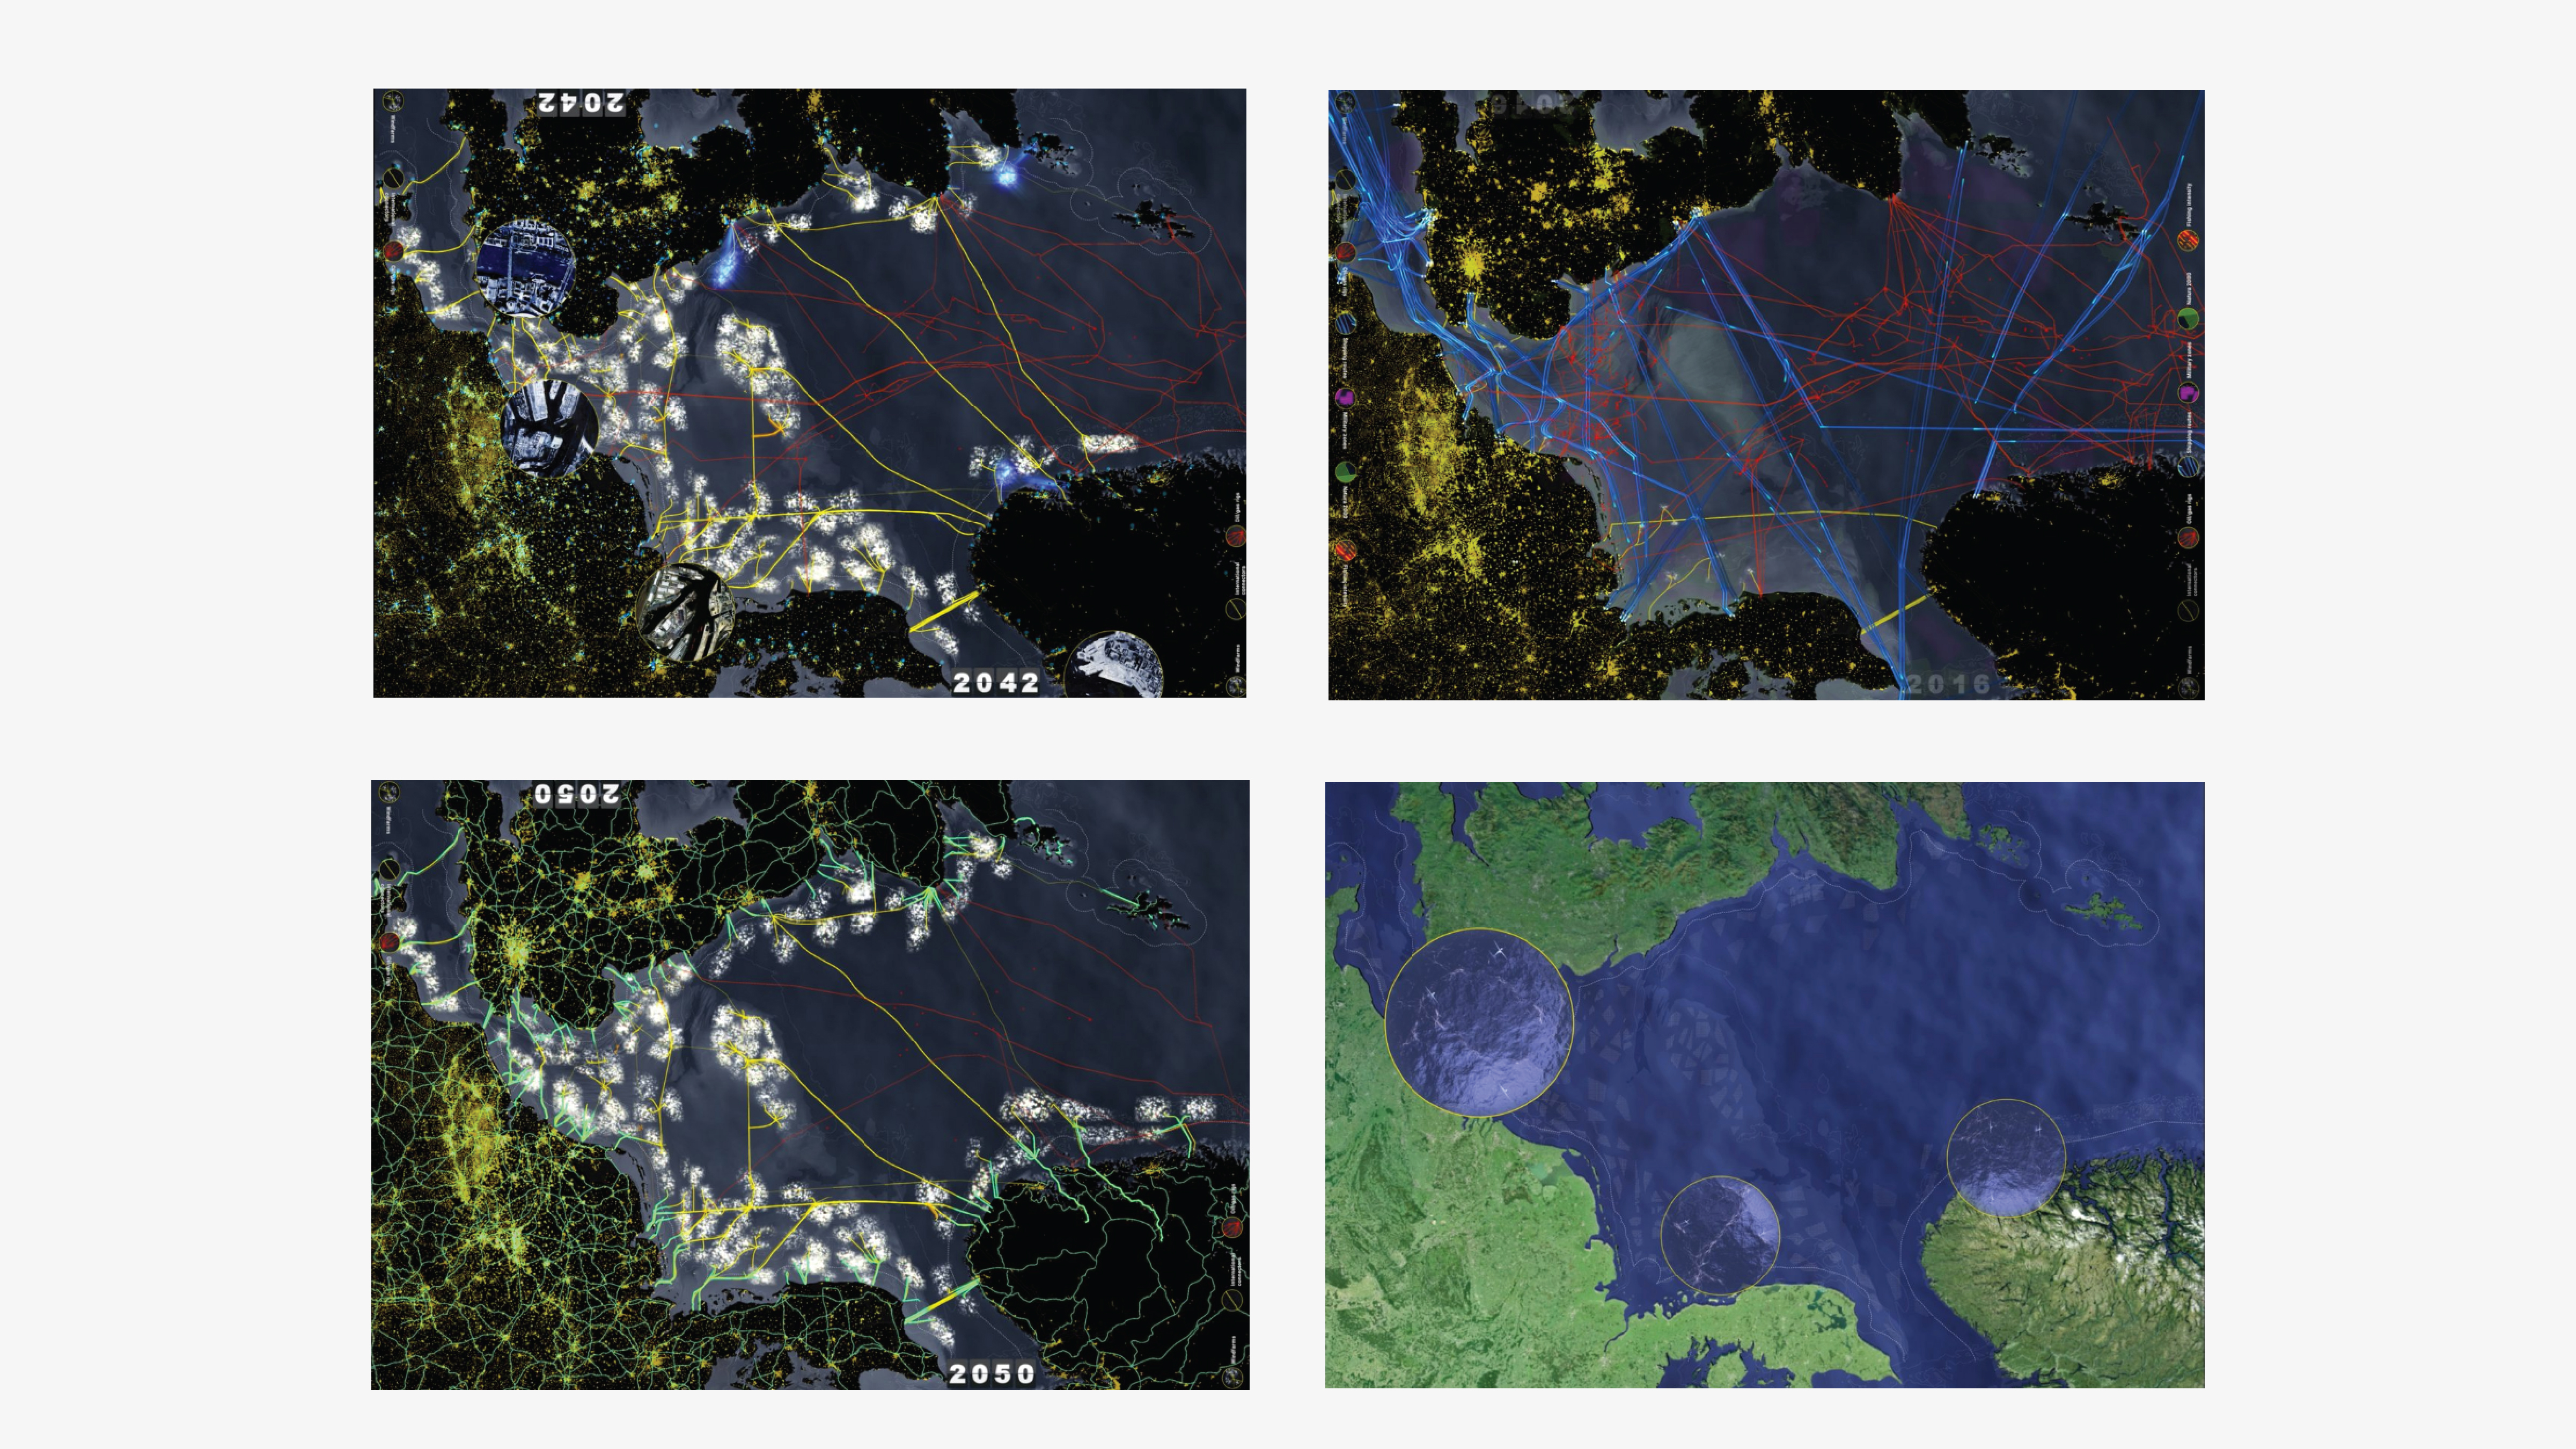
In the 1990s, Germany and Denmark began to explore wind as a new form of energy production in the region, followed by the United Kingdom. This transition was incentivized by national policies to diversify and decarbonize the electrical grid.
Since the 1990s, the North Sea has become a hub for various forms of offshore energy production due its relatively shallow bathymetry, political stability and the short distance to major cities and energy hubs. Over sixty years, the North Sea region has built up significant energy infrastructure from drydocks to build turbines and platforms to barges and aircraft to maintain and service this infrastructure. Additionally, there is significant technical expertise from engineers, designers and workers in the area. Looking ahead, in the United Kingdom, it’s estimated that the offshore energy industry will shift to the wind sector, while the North Sea oil and gas sector declines. Many of the skills and competencies for North Sea offshore energy are transferrable, meaning workers in the oil and gas industry will be able to transfer their skills into the renewable energy sector.
In addition to labor and material considerations, North Sea energy projects require public support not only for the infrastructure itself, but also for decarbonization through renewable energy. The Dutch landscape 12firm H+N+S Landscape argued for a “persuasion by collective immersion” in their 2016 Venice Biennale installation titled 2050 - An Energetic Odyssey. The 12-minute animated narration showed how depoying 25,000 wind turbines in the North Sea could provide 90% of the electricity for countries that border the Sea by 2050. The large-scale projection was used to argue that transitioning to a renewable energy economy is less a crisis of technology, policy or labor capabilities, but rather a crisis of the imagination. By immersing visitors to the installation in this new near future fiction, the installation sought to convince viewers that the North Sea could easily be a future renewable powerhouse - but only with public support.
The North Sea energy hub will continue to evolve with new technologies. The first floating offshore wind platform was deployed in 2009 in the North Sea by Equinor. Floating offshore wind farms can be sited deeper, farther from shore, in areas with a steadier wind speed. Today, each square meter in the North Sea produces roughly 30 kWh of wind turbine energy that is delivered to the grid. In the near future, hybrid platforms transitioning from oil and gas, floating wind, tidal energy lagoons and energy storage, including an artificial renewable energy island off the coast of Denmark are planned.
WIND SYSTEMS: SOURCE, STORAGE, DISTRIBUTION, OWNERSHIP, LABOR
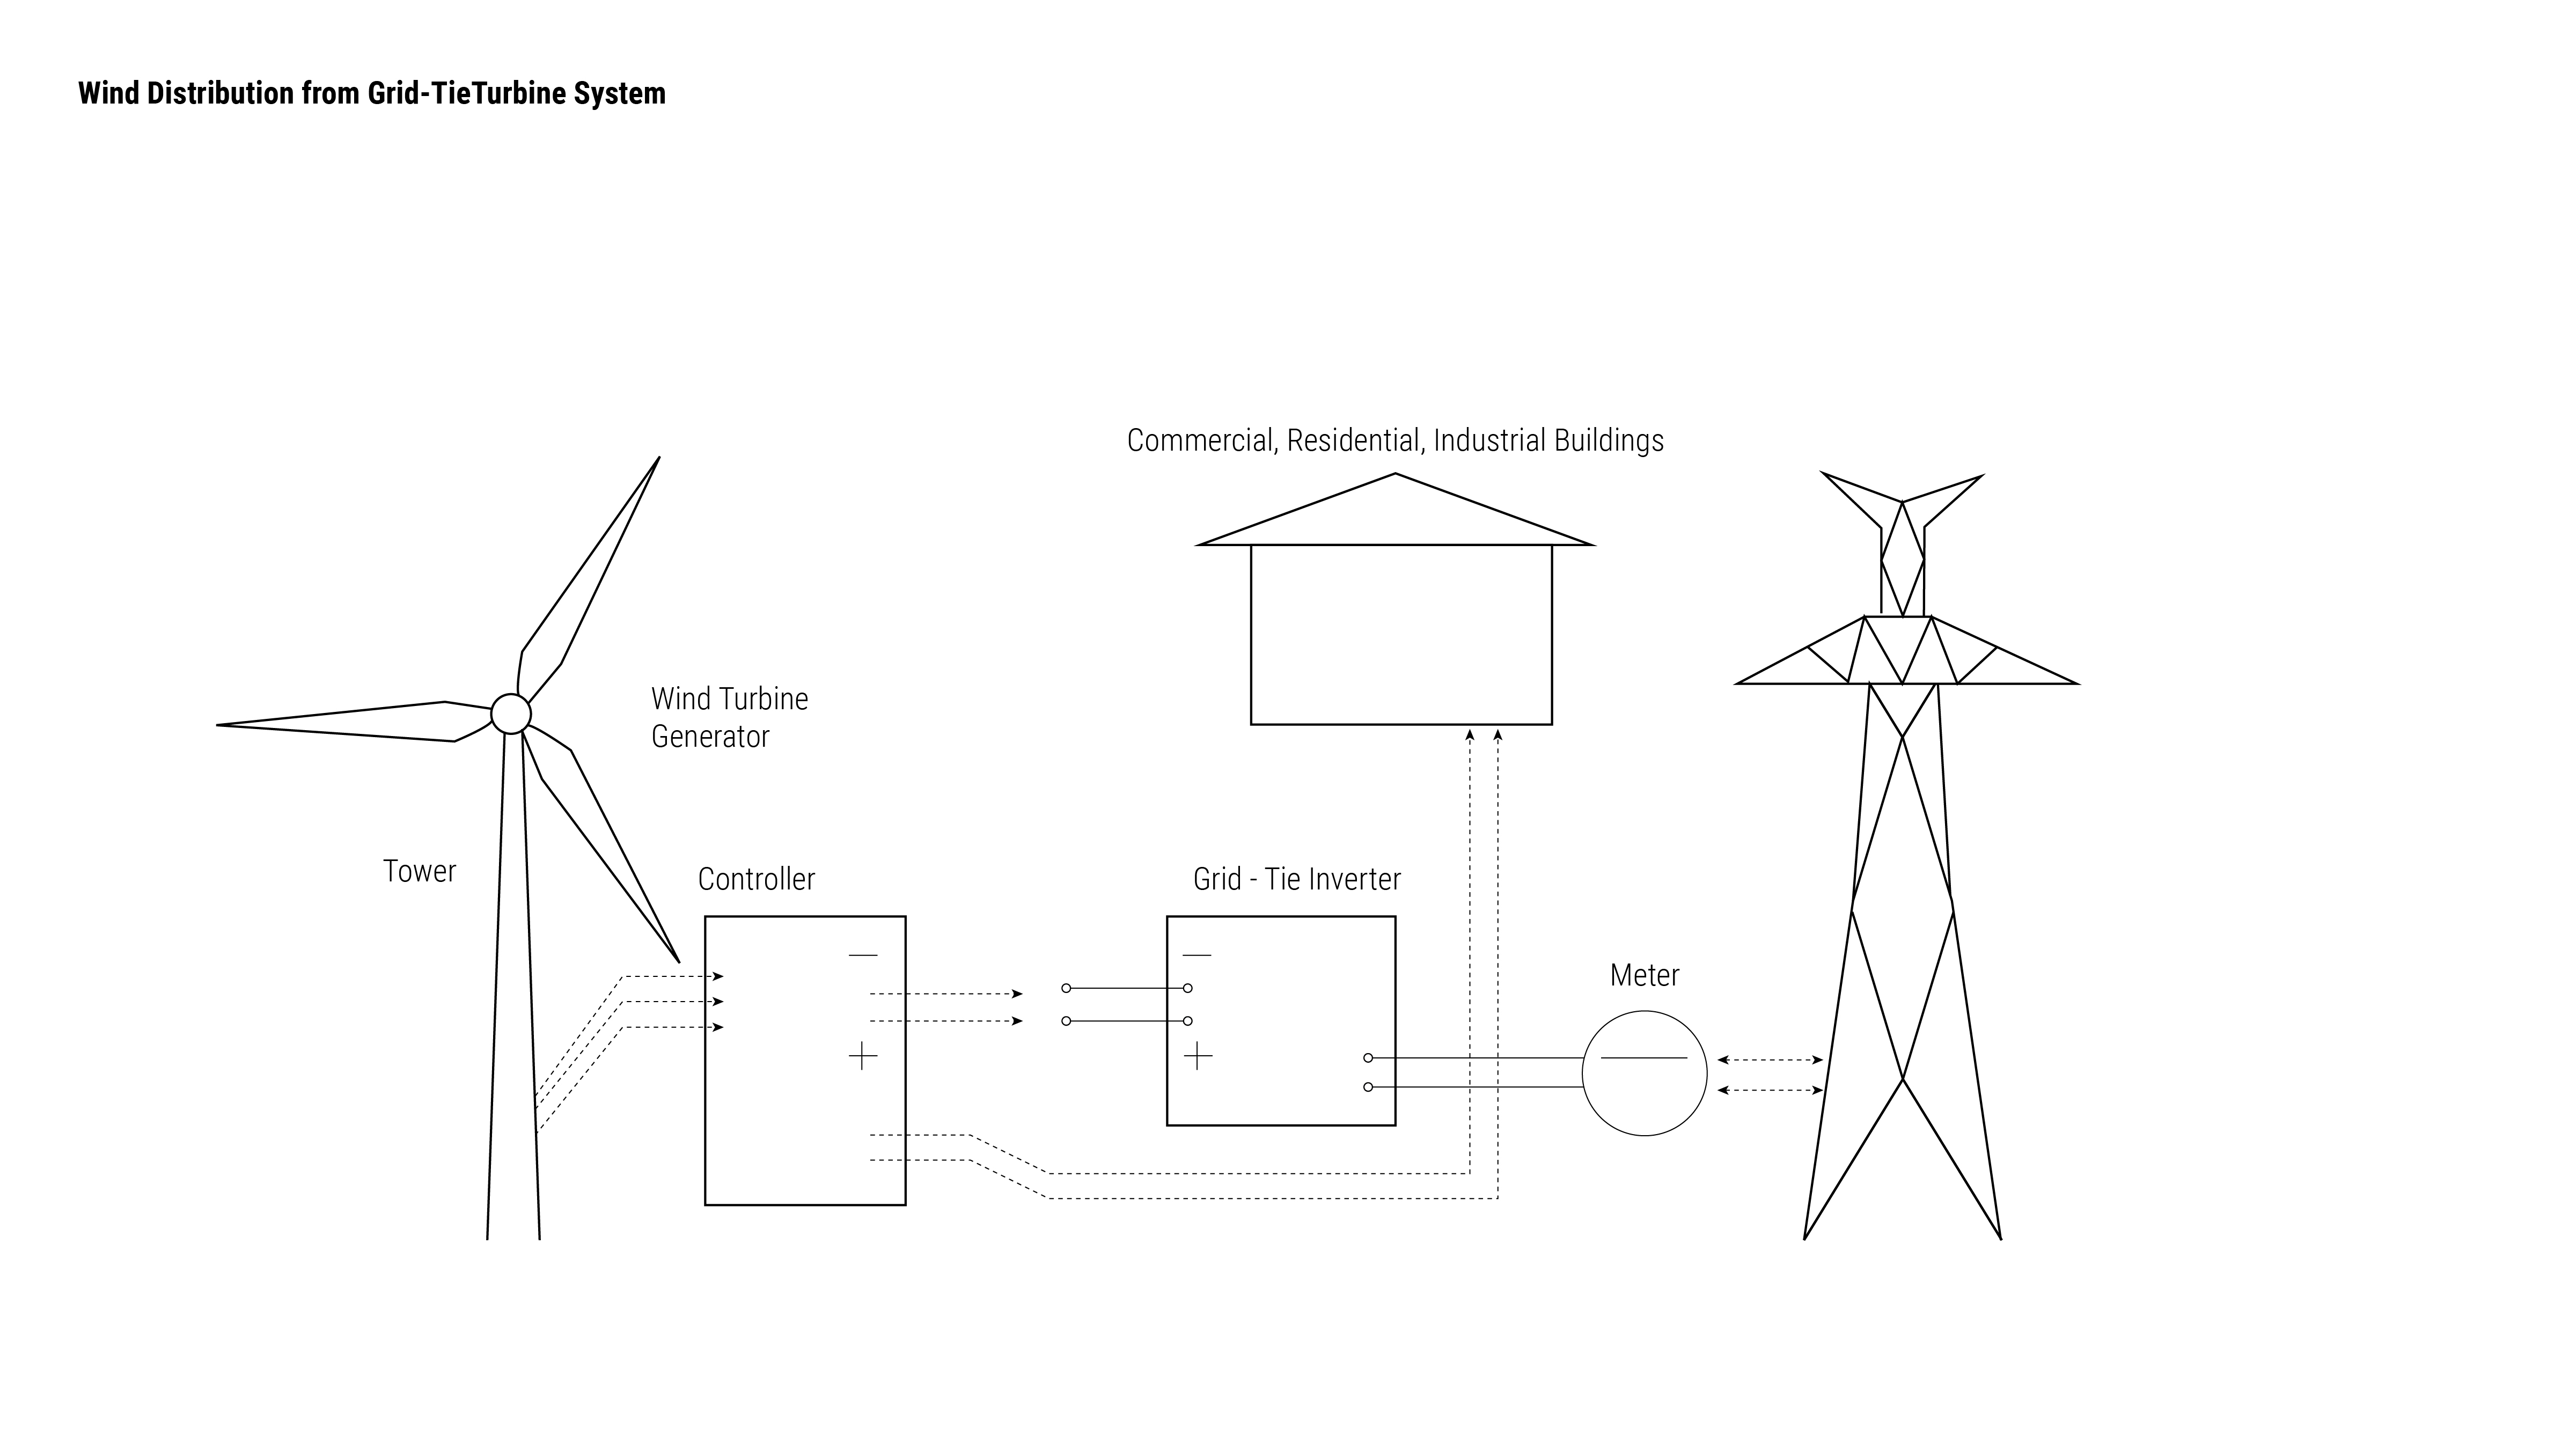
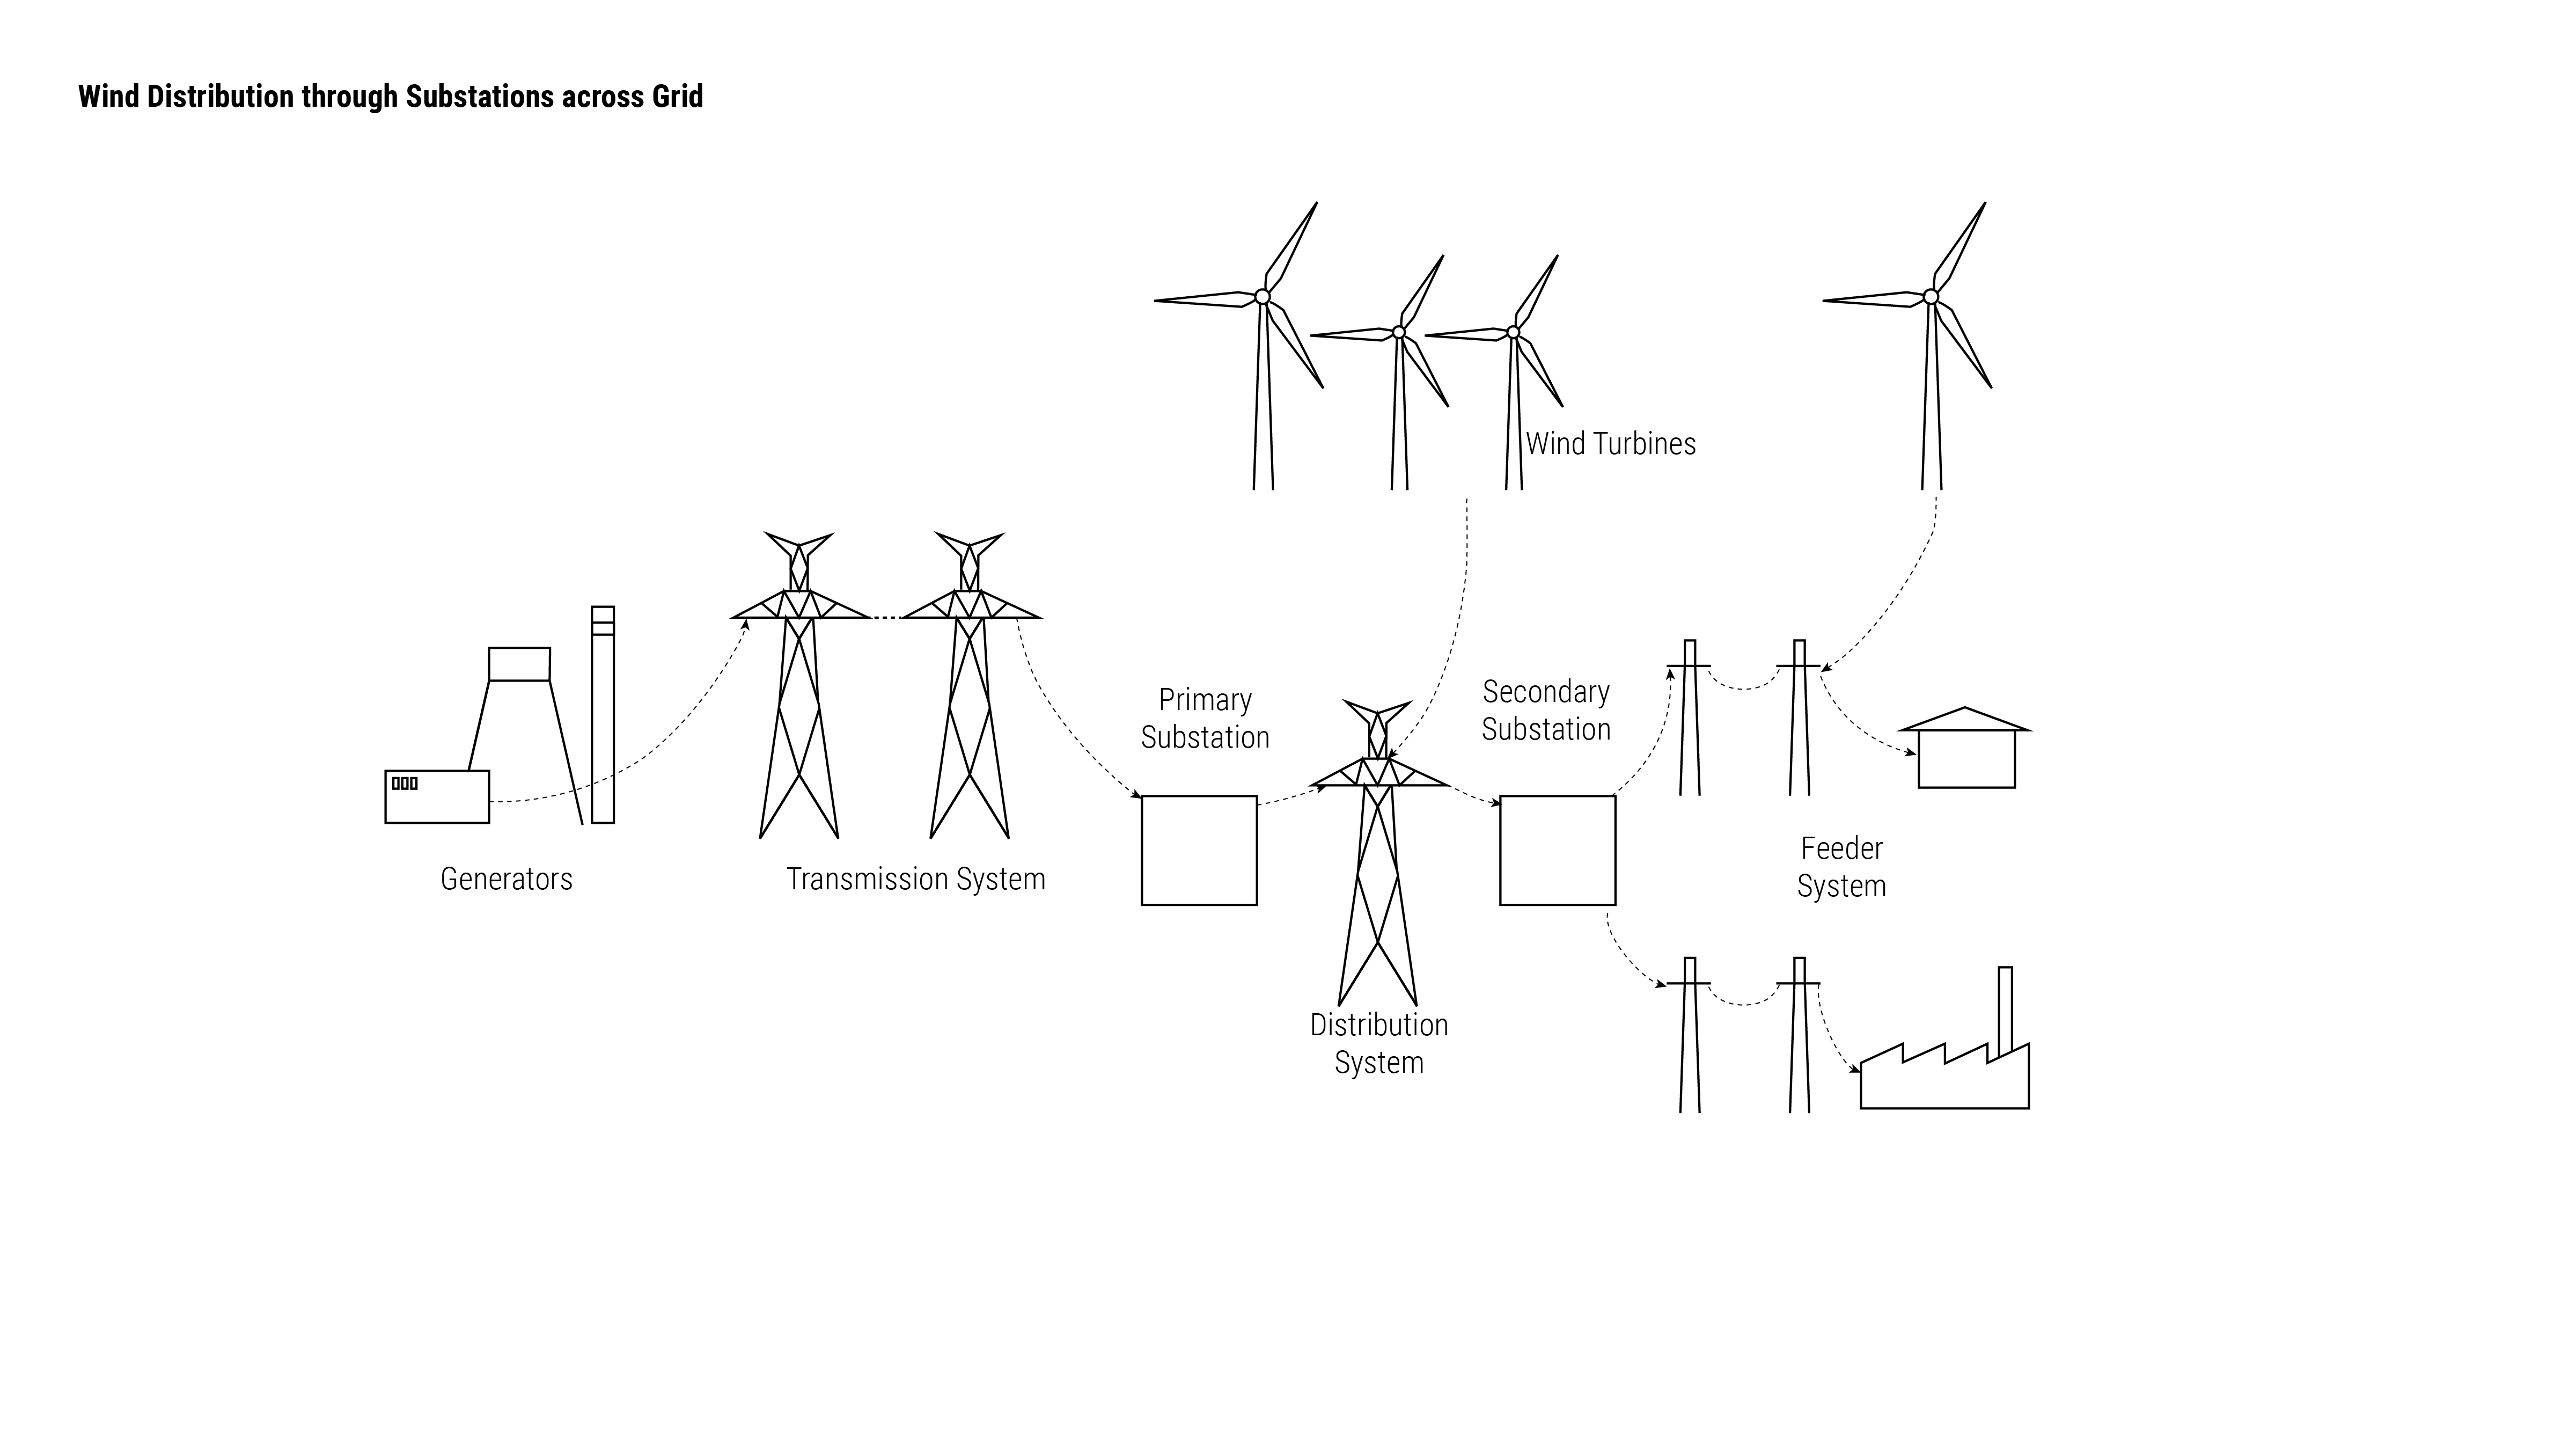
Additionally, wind speeds vary hourly and seasonally. Peak electricity demand does not always line up with the times of day, or year, that the wind is blowing. Most wind farms distribute power directly to the power grid, which requires the turbines are slowed during periods of low demand.
Several new technologies can store wind energy during peak supply and low demand periods to be distributed to the grid during periods of higher demand. Battery storage, compressed air and hydrogen fuel storage can store energy at the source of production near the turbine, or in city centers, and distribute electricity to the grid during times of peak demand.
Wind systems therefore require workers at the site of generation, including workers who perform maintenance on turbines, as well as labor in cities and urban centers where electricity is most consumed. The transition to renewable energy has also caused disruptions in the labor force. Oil and gas sector workers have transitioned their skill sets from fossil fuel energy production to renewable energy.
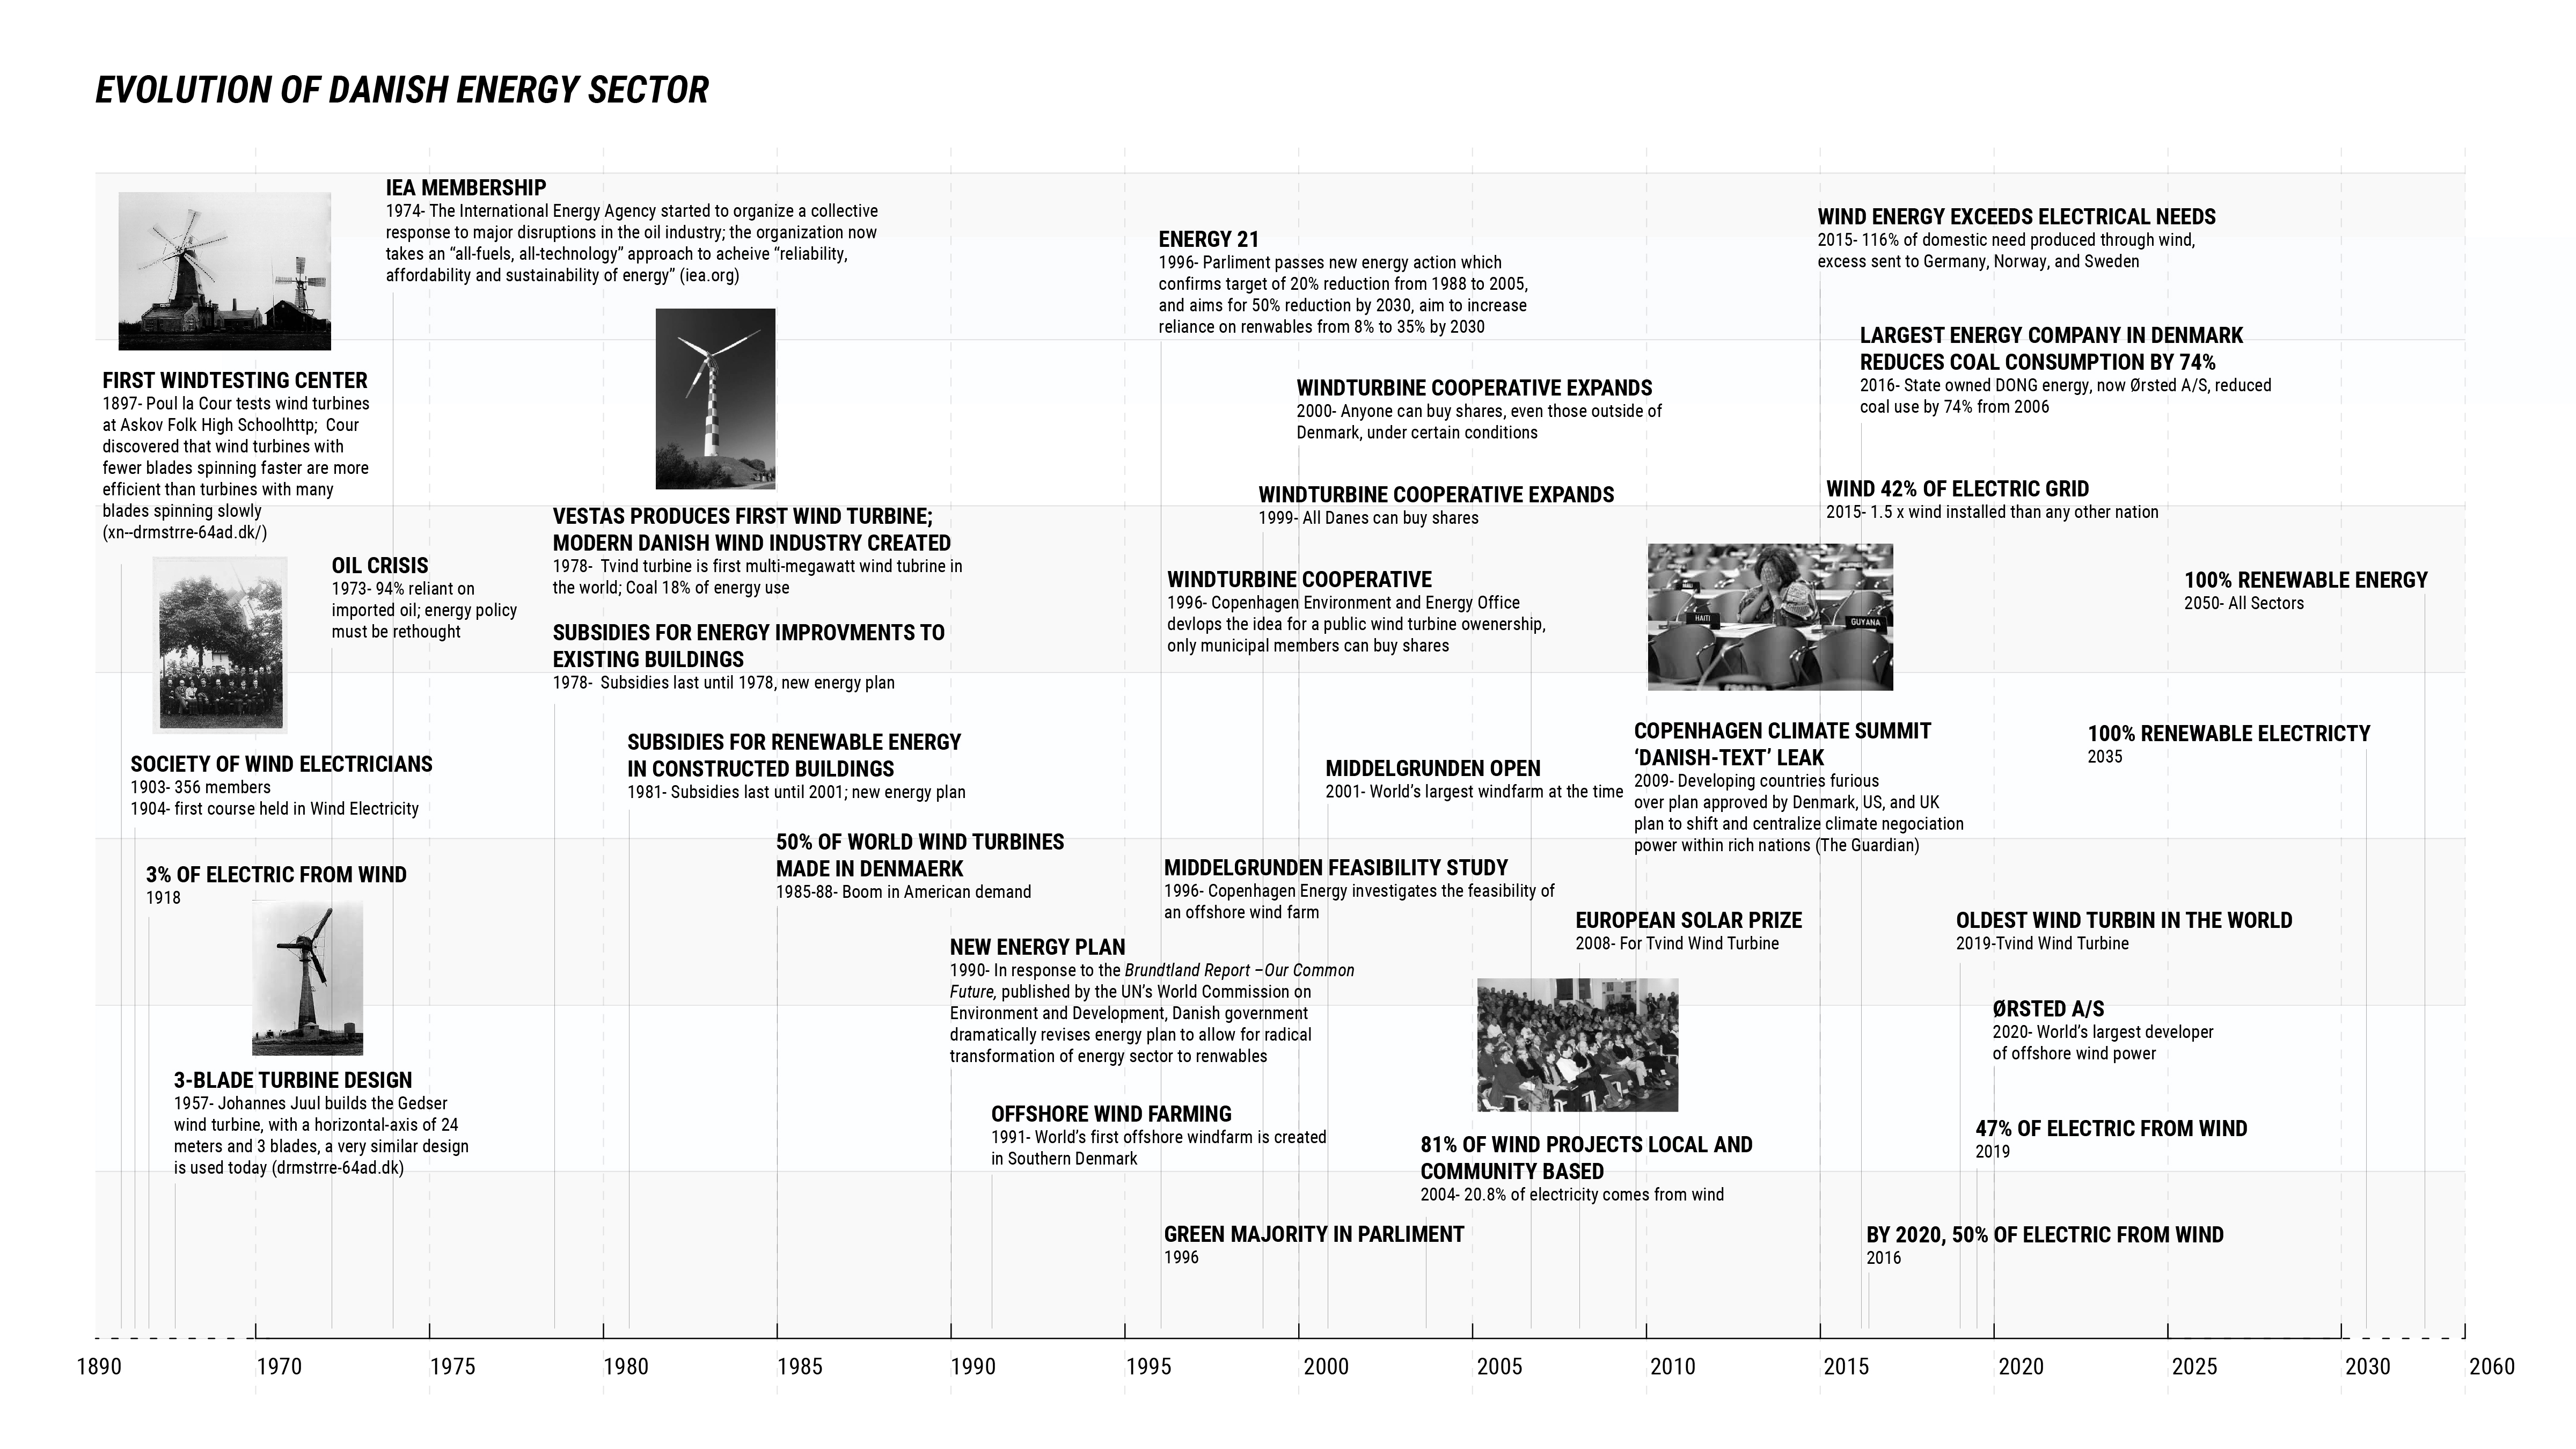
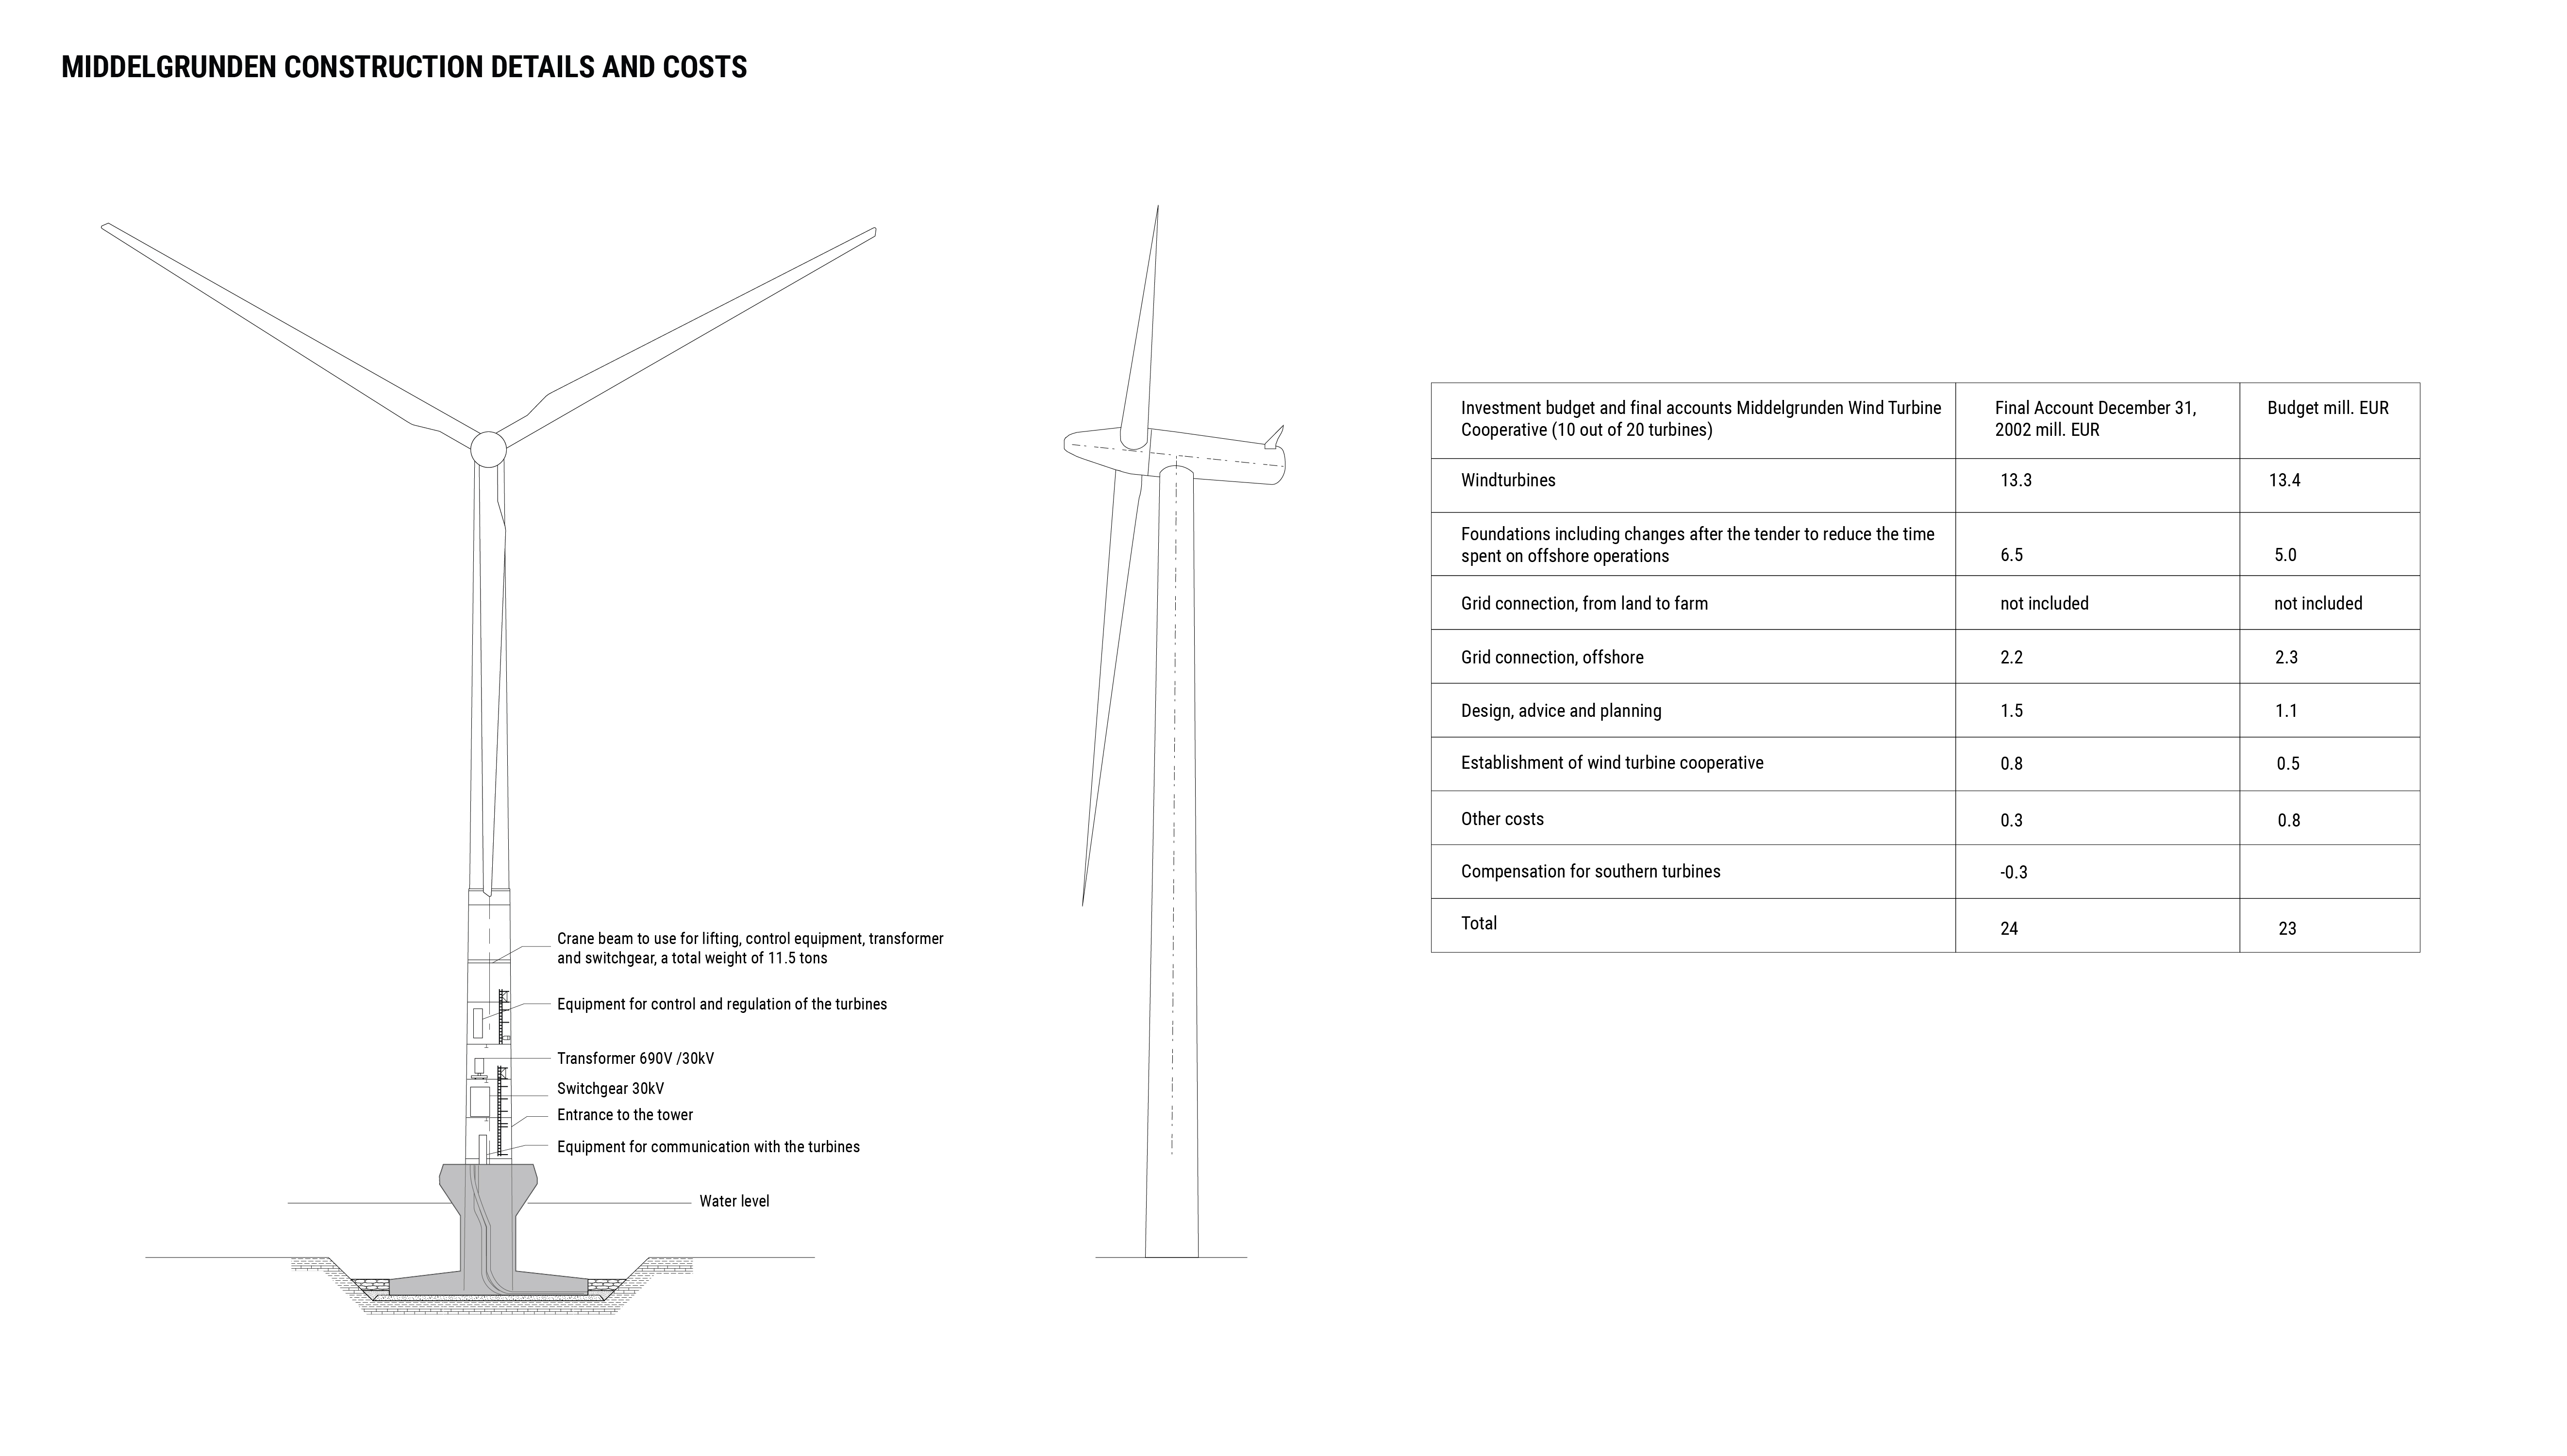
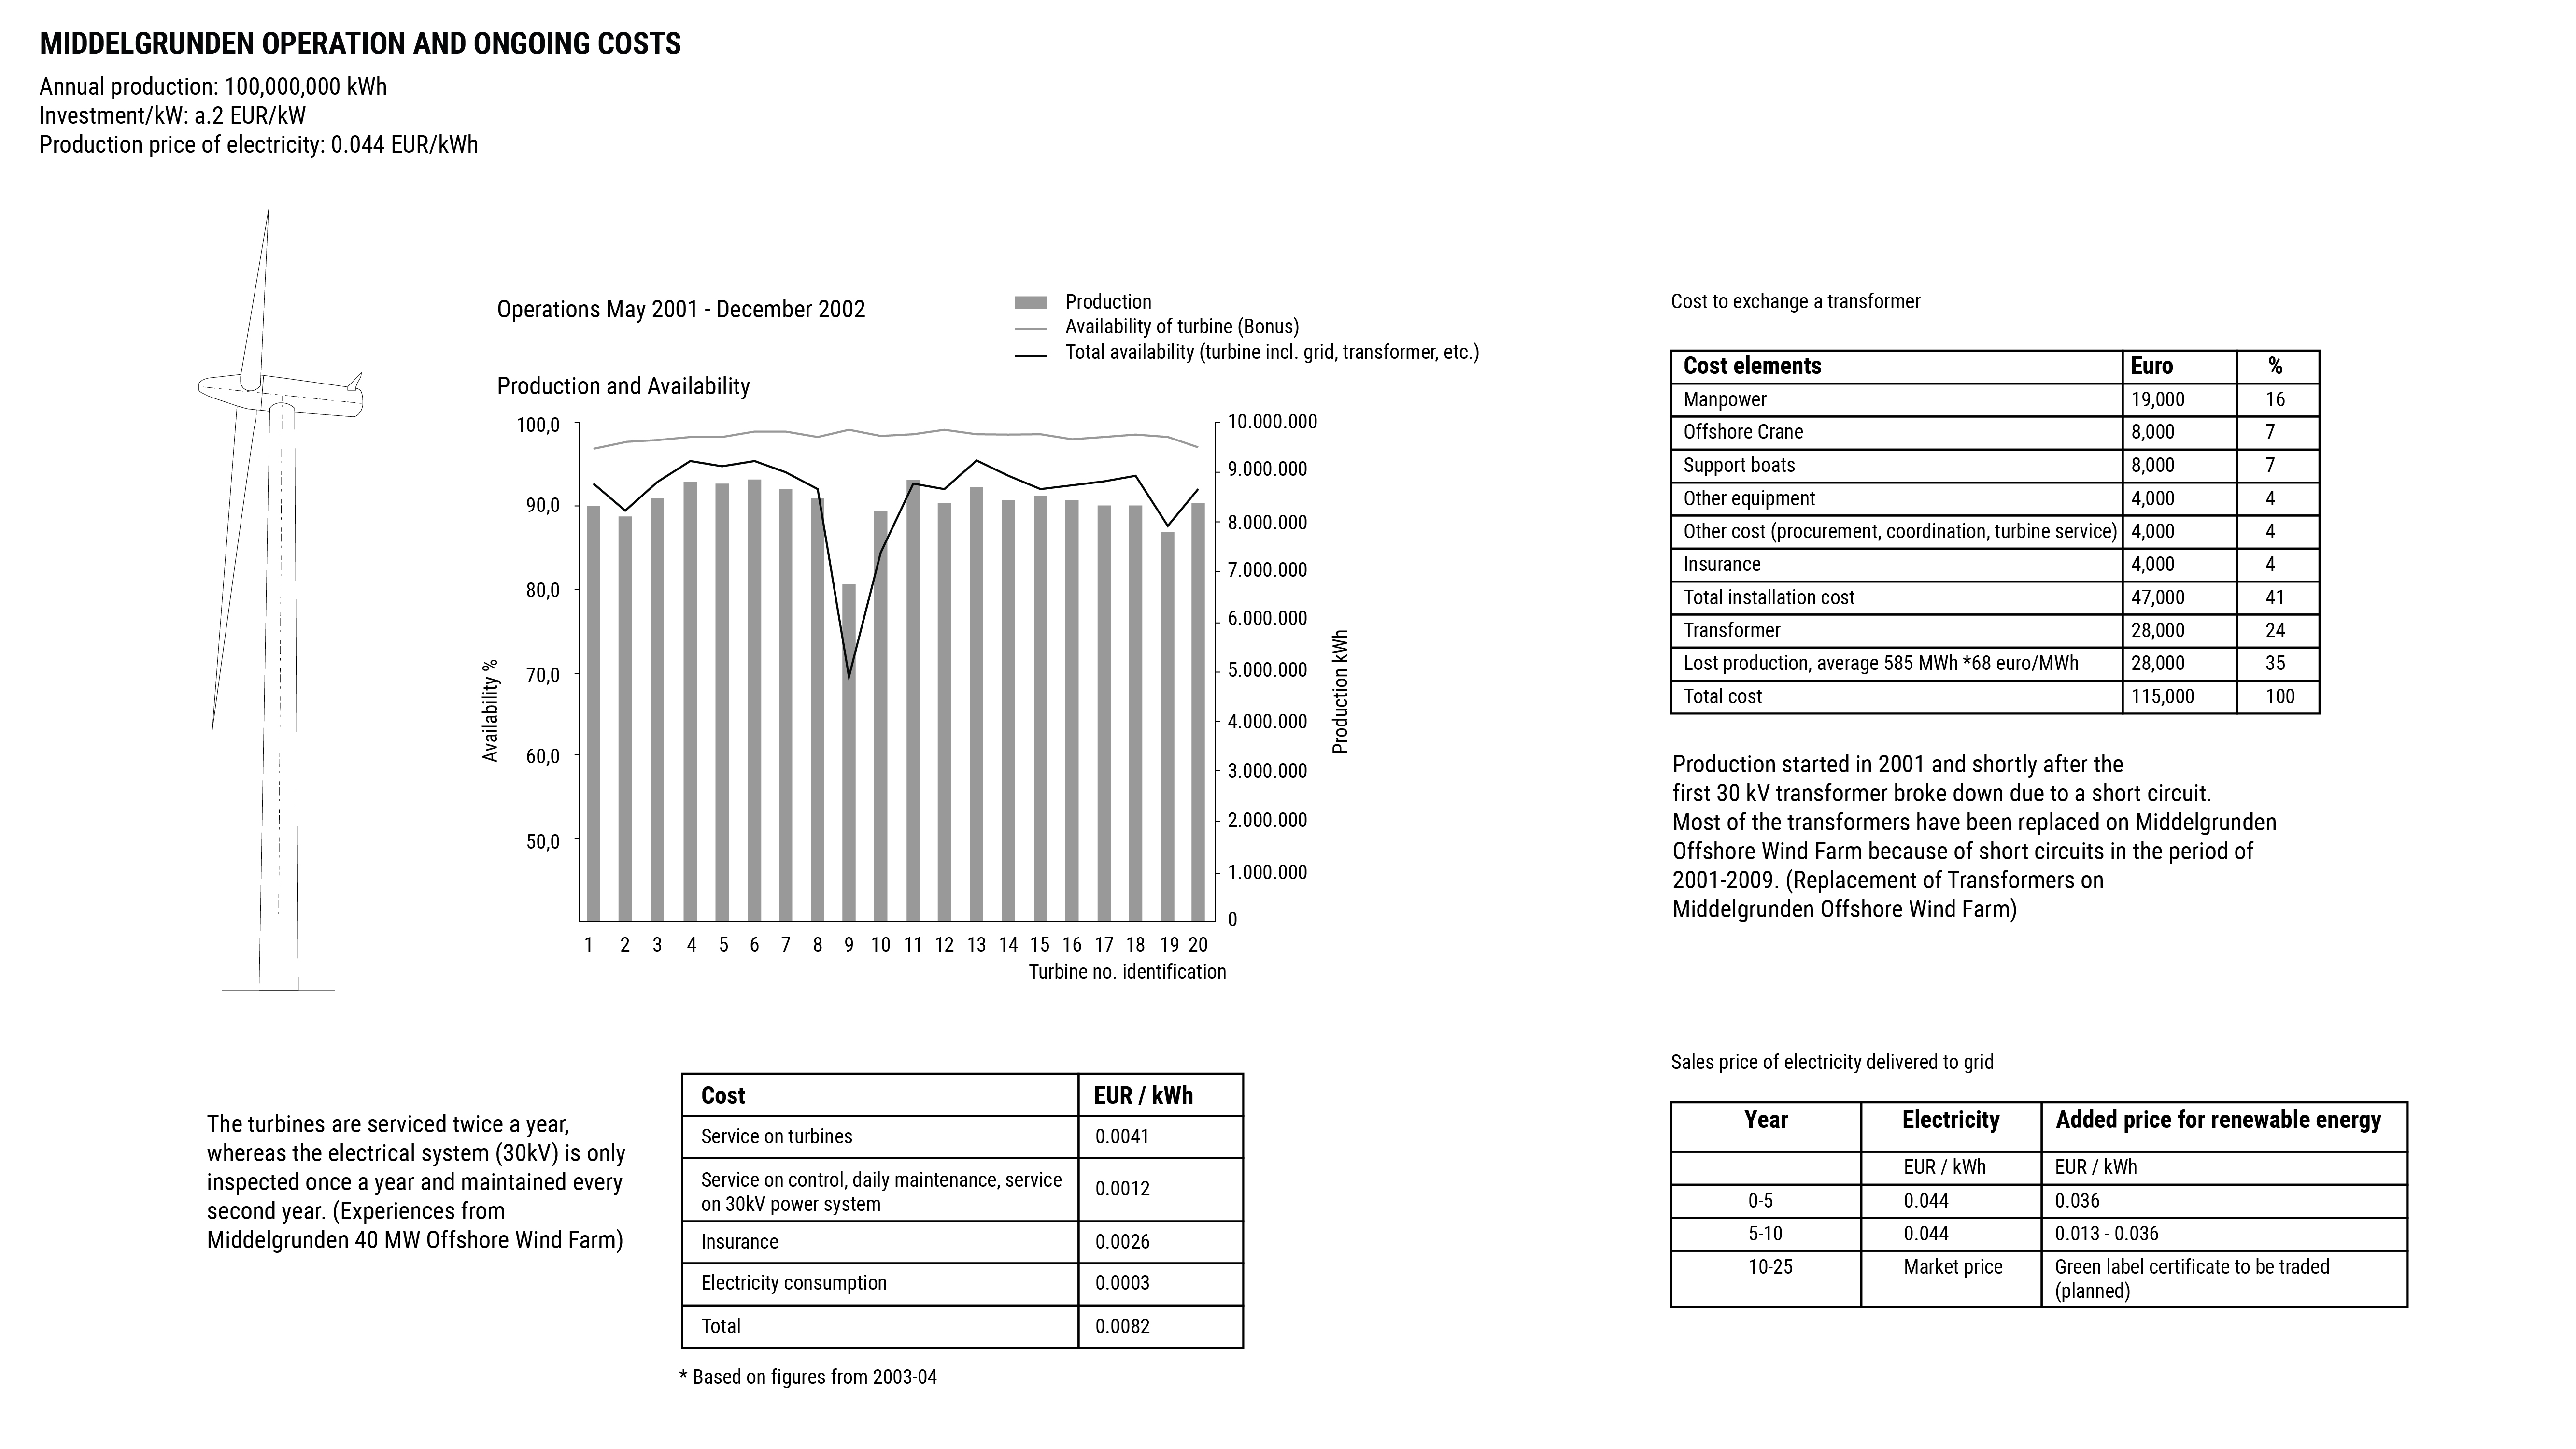
The Middelgrunden project in Denmark illustrates how energy systems can be owned and extend far beyond their geographic location. The offshore wind project cost approximately $60 million to build, and was financed through a private cooperative partnership between two firms: Københavns Energi (Copenhagen Energy, owned by the Municipality of Copenhagen) and Middelgrundens Vindmøllelaug (the Middelgrunden Wind Turbine Cooperative), which was founded at the outset of the project in 1997.
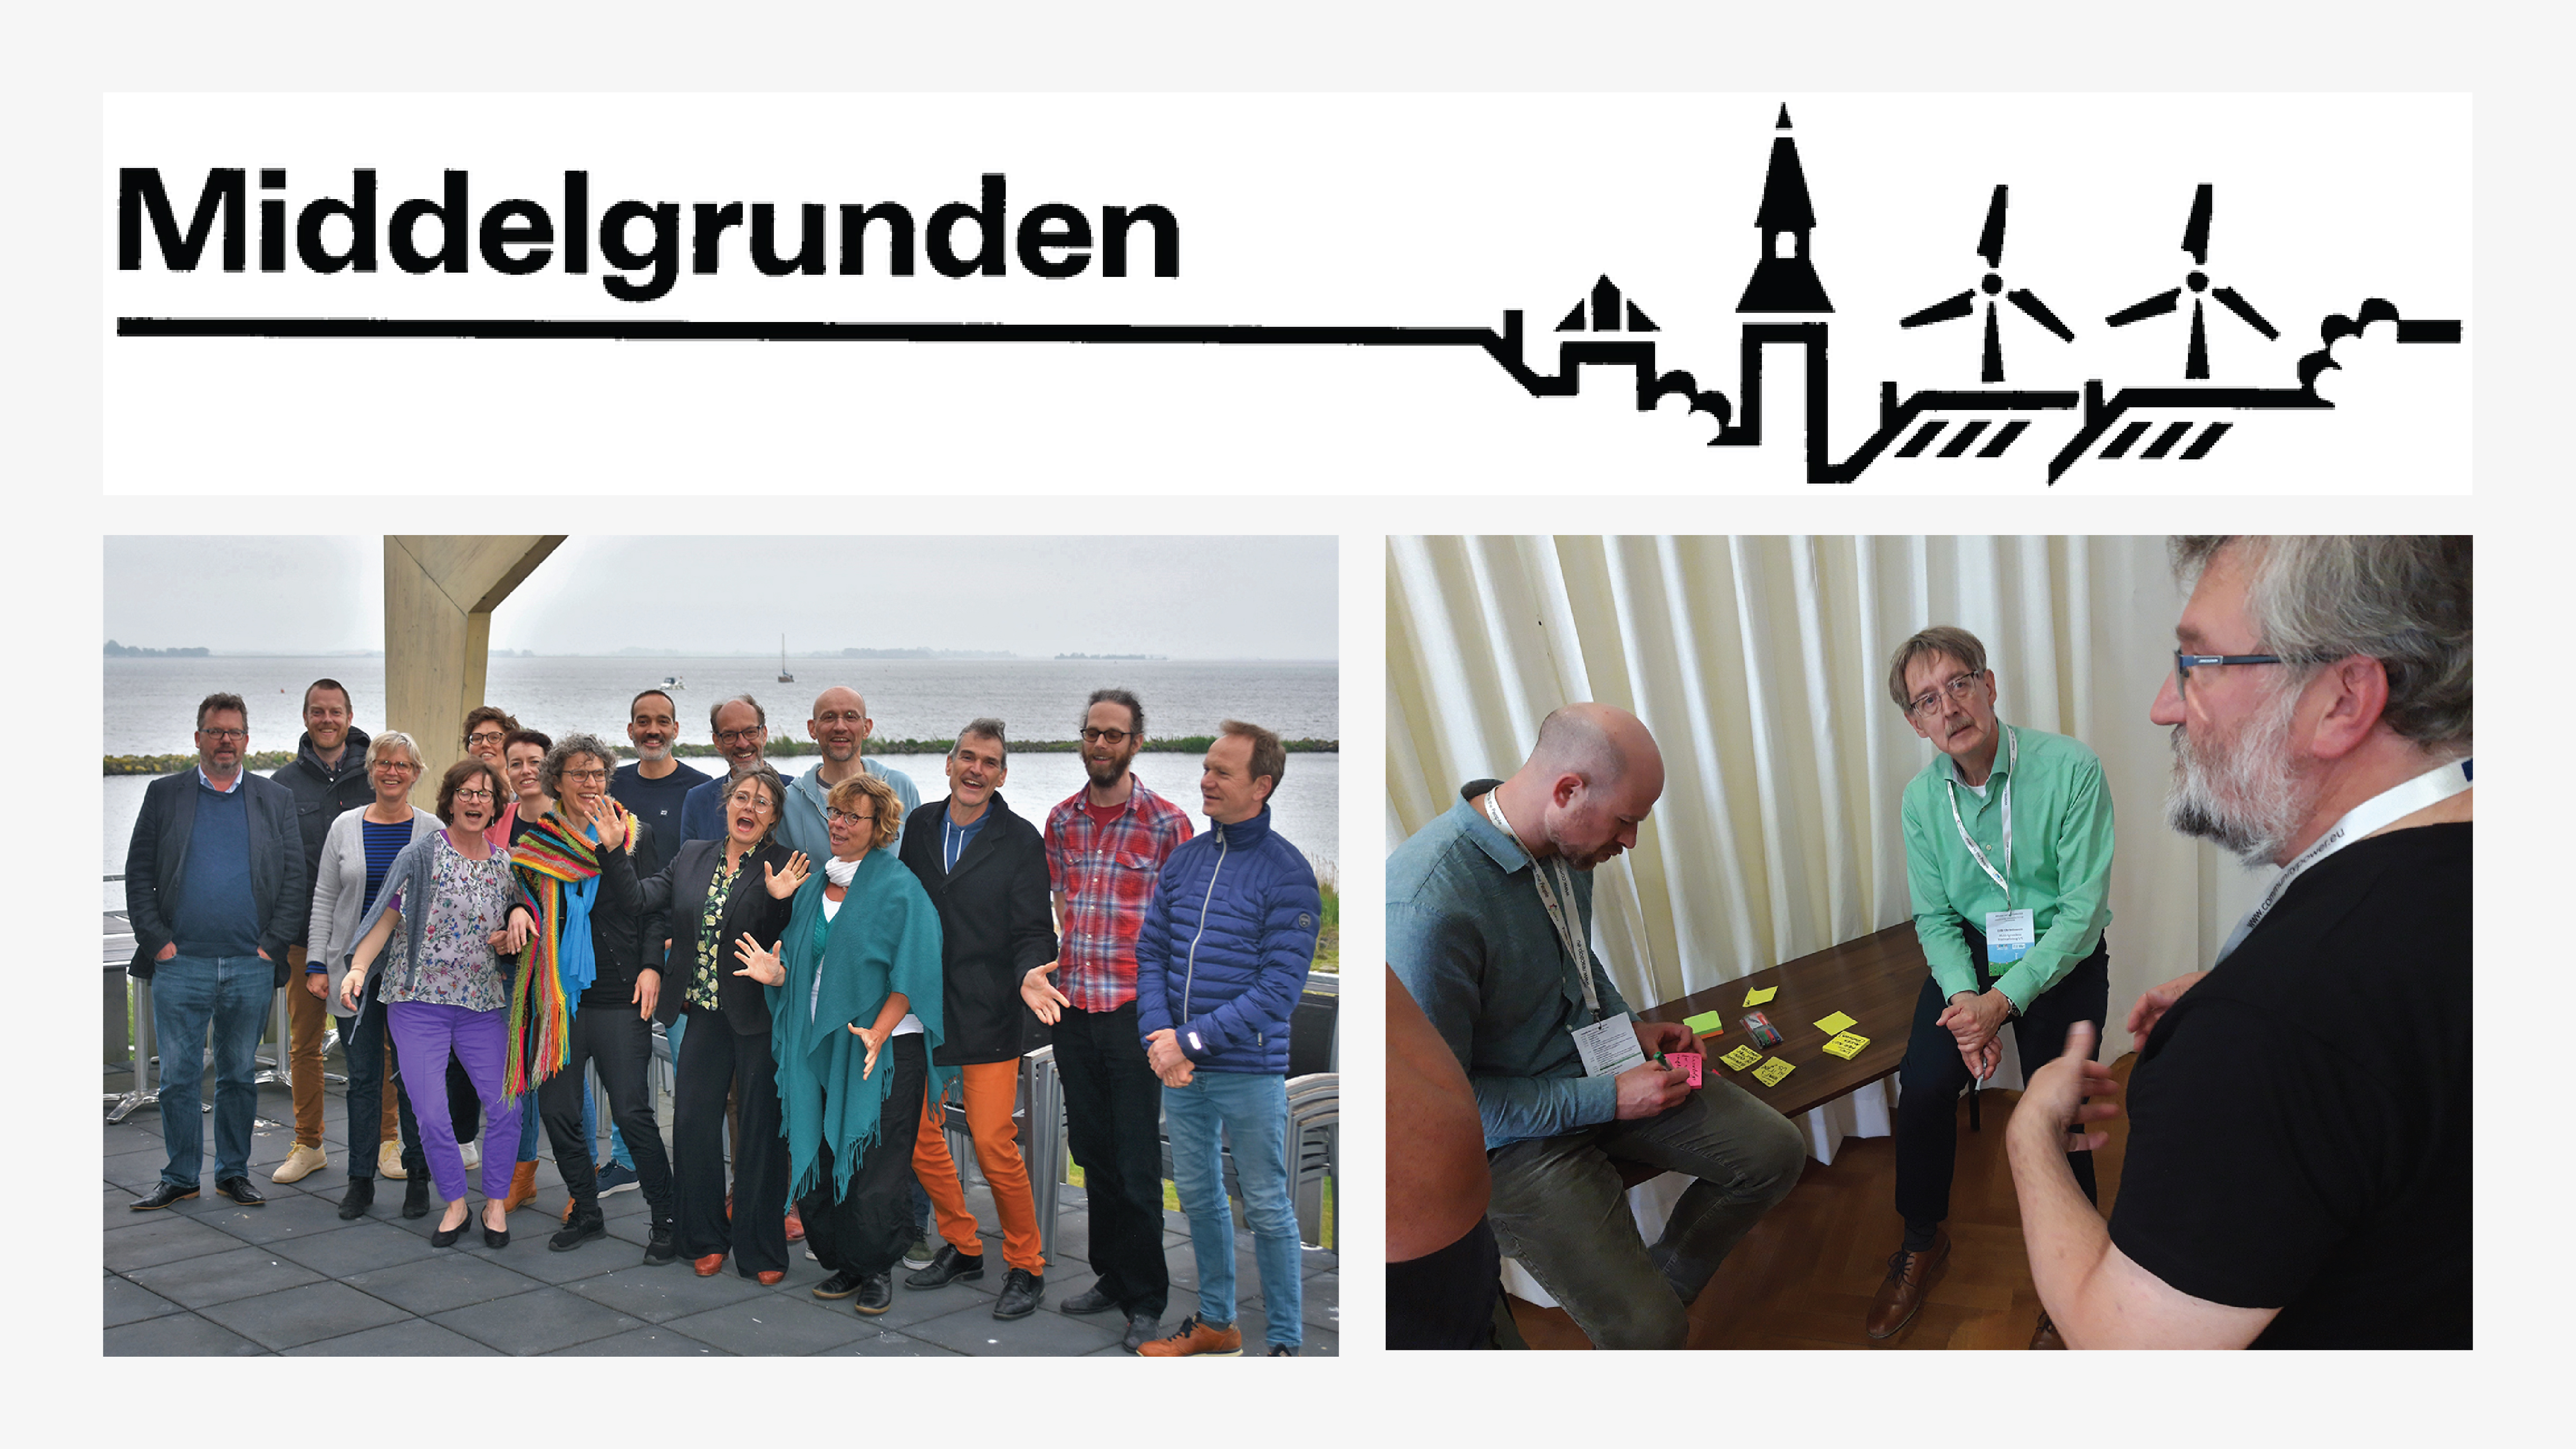
The Middelgrunden Cooperative worked to secure local acceptance for the project early in the design process, beginning with a campaign to educate the public about wind energy, and raise awareness about locally produced electricity. The Middelgrunden Cooperative includes 8,552 electricity consumers who are co-owners of the wind farm. These shareholders are largely Copenhagen residents, as well as companies, organizations and unions who invested in the project.
THE CASE OF MIDDELGRUNDEN
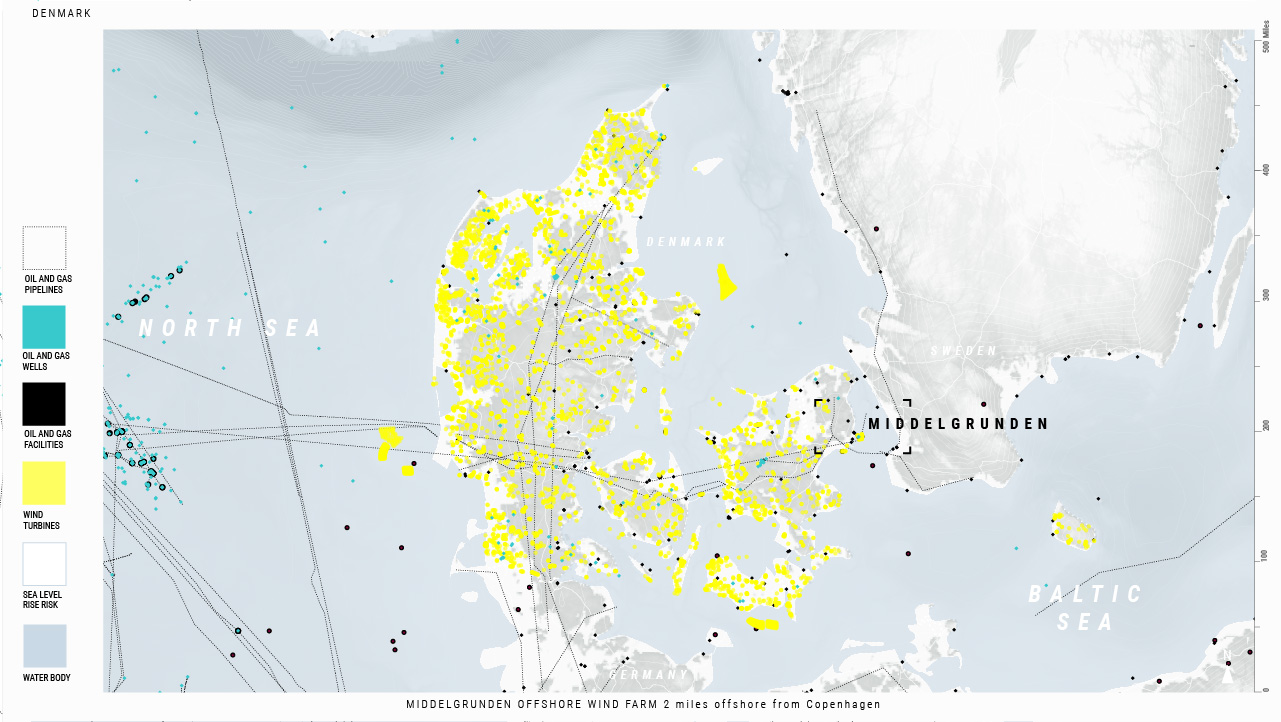
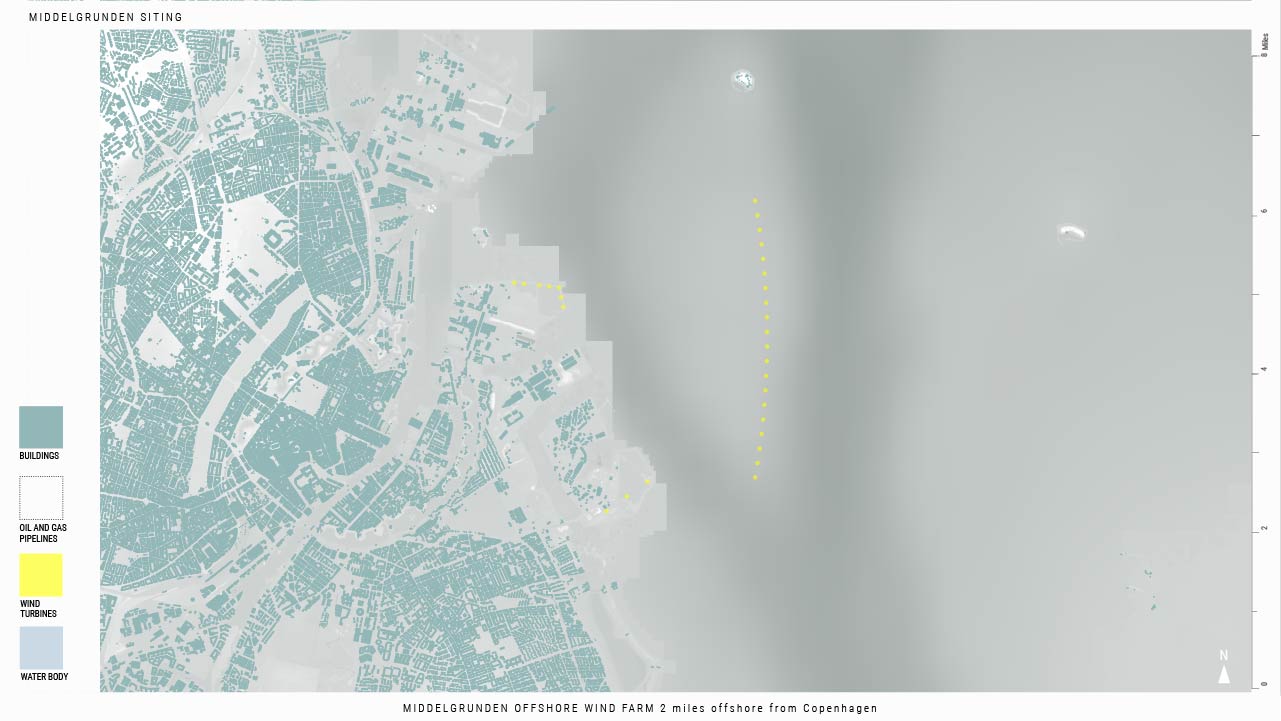
Middelgrunden was the world’s largest offshore wind farm when it opened in 2001. The arc of 20 windmills are built in the Øresund, or the strait that forms the Danish-Swedish border. The project was initiated in 1996, with public hearings from 1997 to 1999. These hearings included two visualizations of the project and an Environmental Impact Assessment Study. Public input on the visualizations led to changes in the original design plan for 27 turbines in three rows to 20 turbines in a slight arc. Construction began in 2000, and was completed by the end of the year.
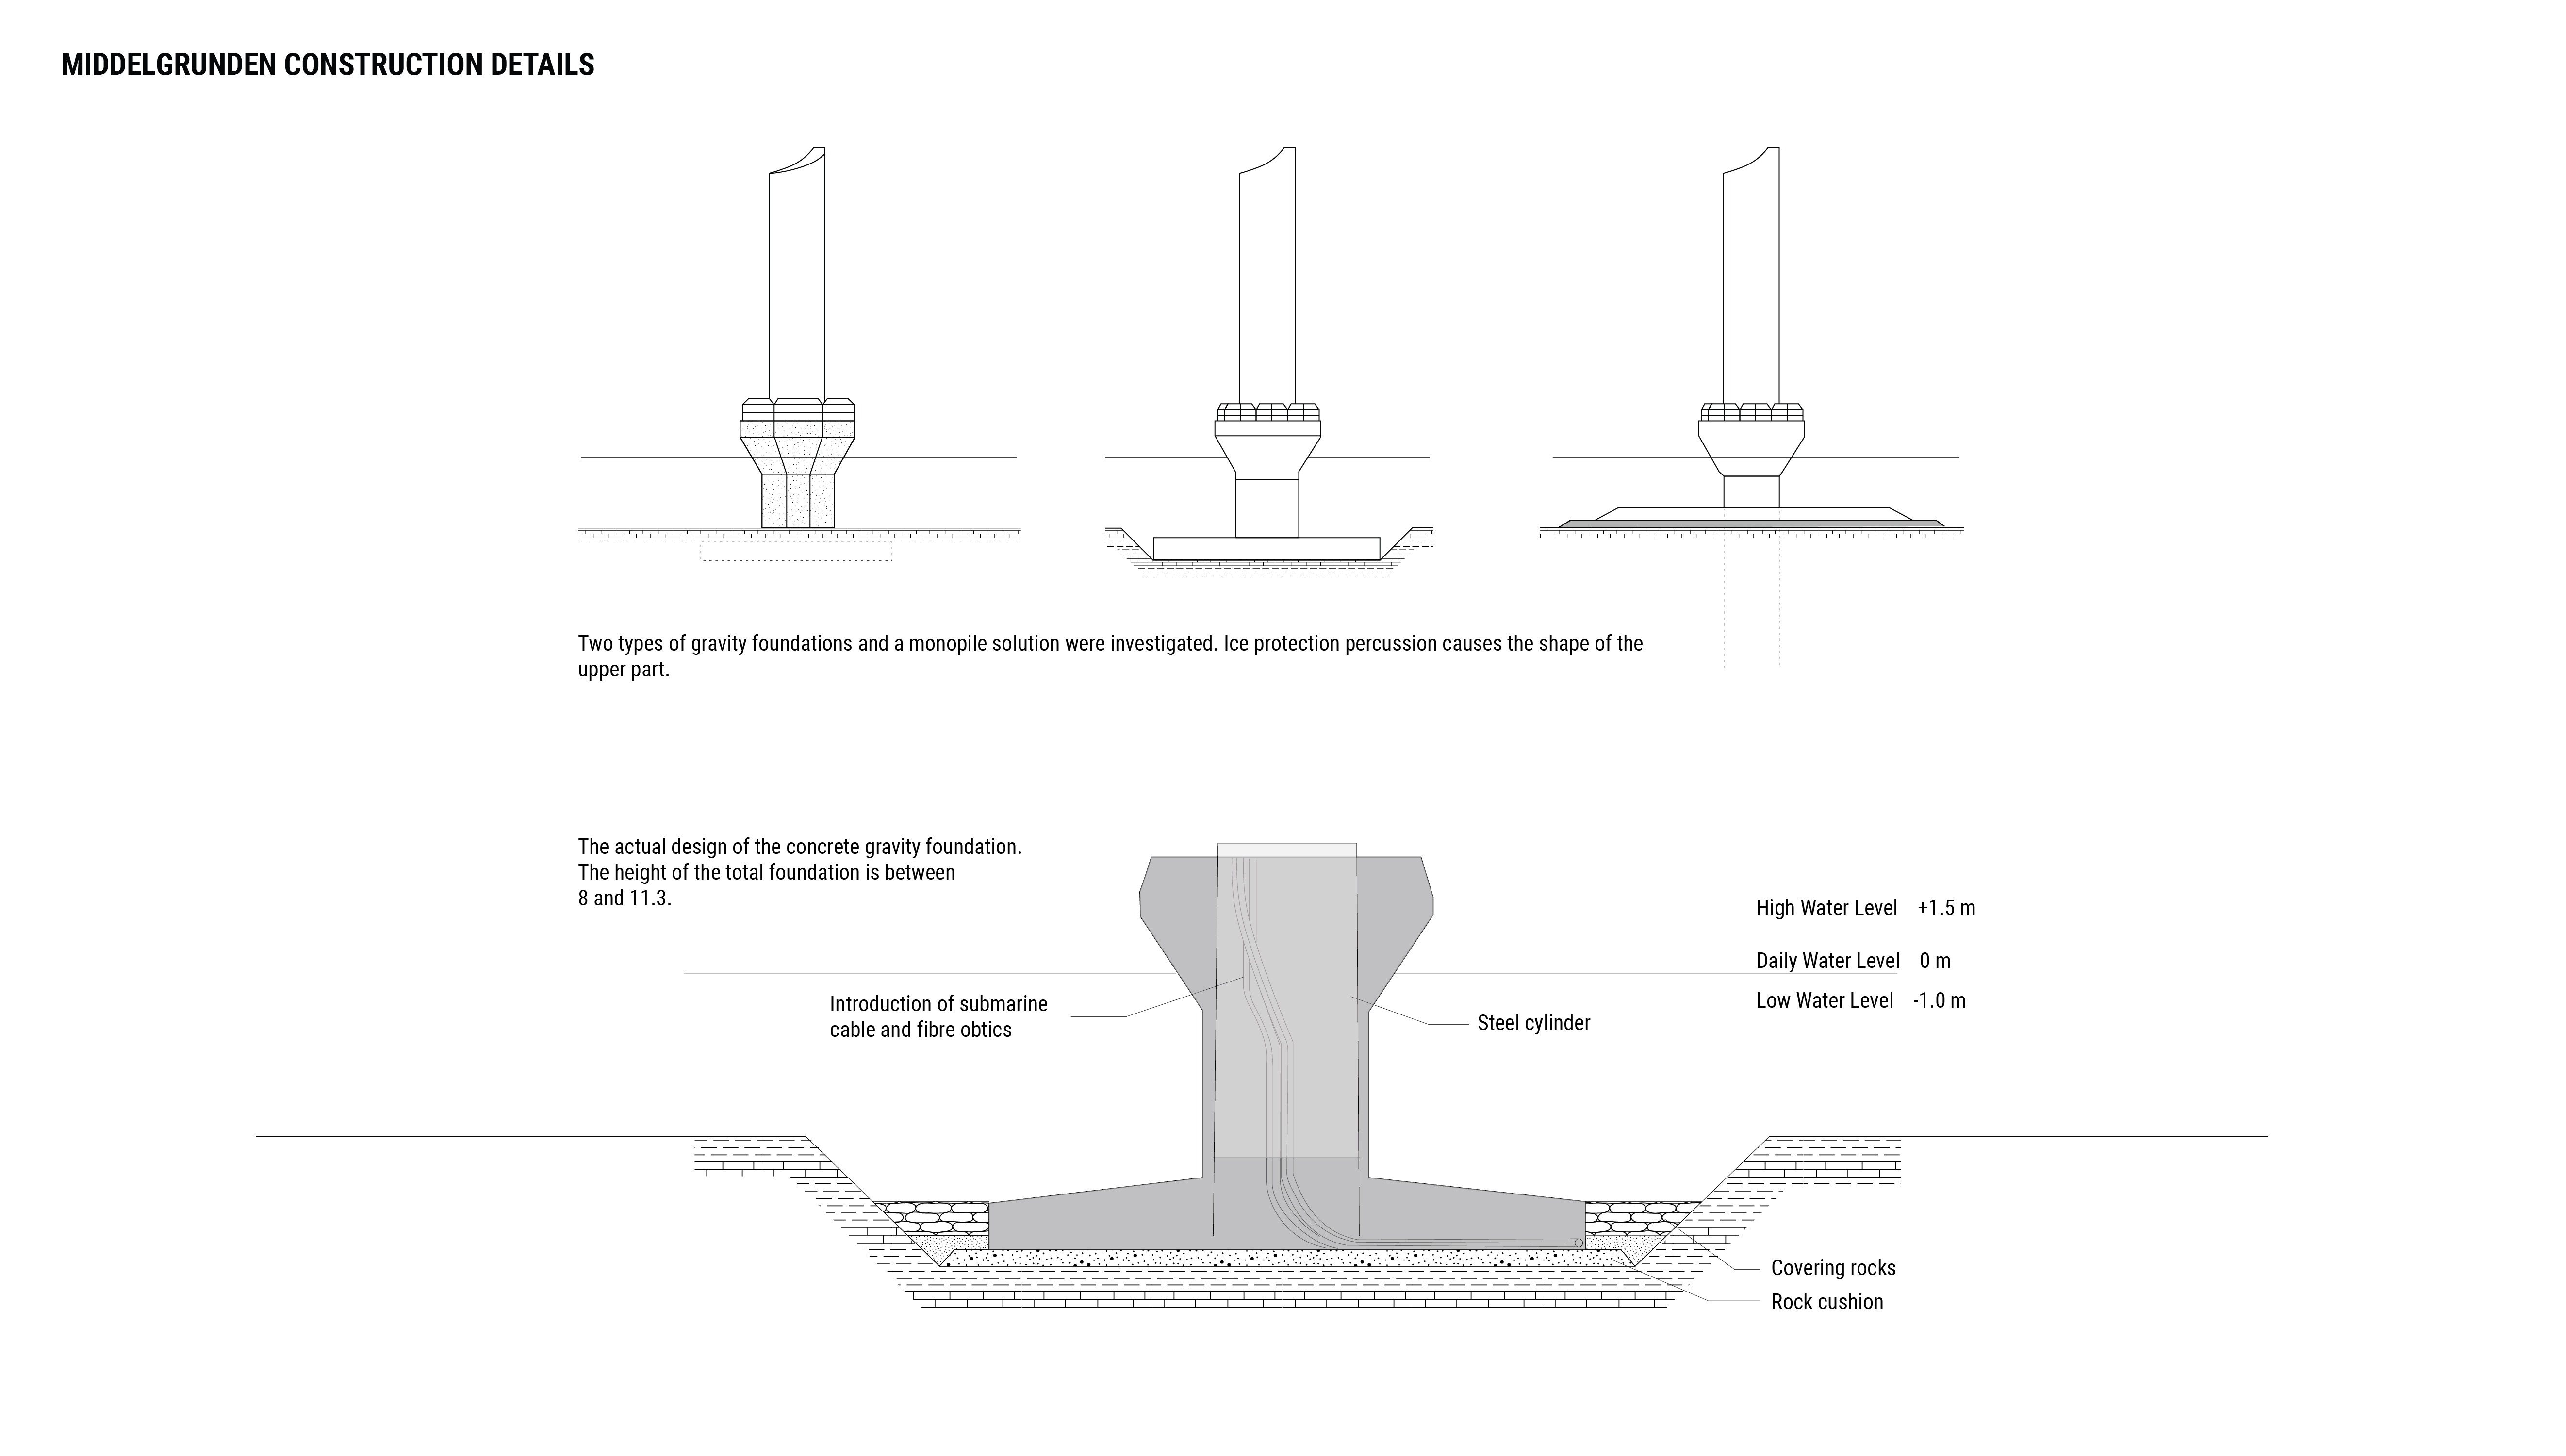
The farm includes 20 turbines that are built on a former dump site in the Øresund, in 6-18 feet of salt water. To avoid saltwater corrosion, each turbine tower is painted with a resistant external paint, and equipped with internal climate control and hydraulic cranes for service operations. The rotor blades are made of fiberglass, and are therefore resistant to corrosion.
To construct the project, the foundations were precast in a drydock in Copenhagen’s harbor, and the foundations were cast in uniform dimensions. The turbine components were all assembled in the harbor and shipped to the site using a barge, crane and platform.
The turbines produce 85,000 MWh of power annually, or 3% of the total power consumption of Copenhagen alone.
The Middelgrunden Cooperative owns and manages the 10 southern turbines, while Copenhagen Energy owns and operates the ten northern turbines. Both owners collaborate on the operations. The Cooperative brings knowledge from the private wind sector, as well as local commitment, while Copenhagen Energy brings technical knowledge and contractor work to the project.
Region

Cooperative
Site


Construction
Life-Cycle

CONCLUSIONS: TOWARD A JUST TRANSITION
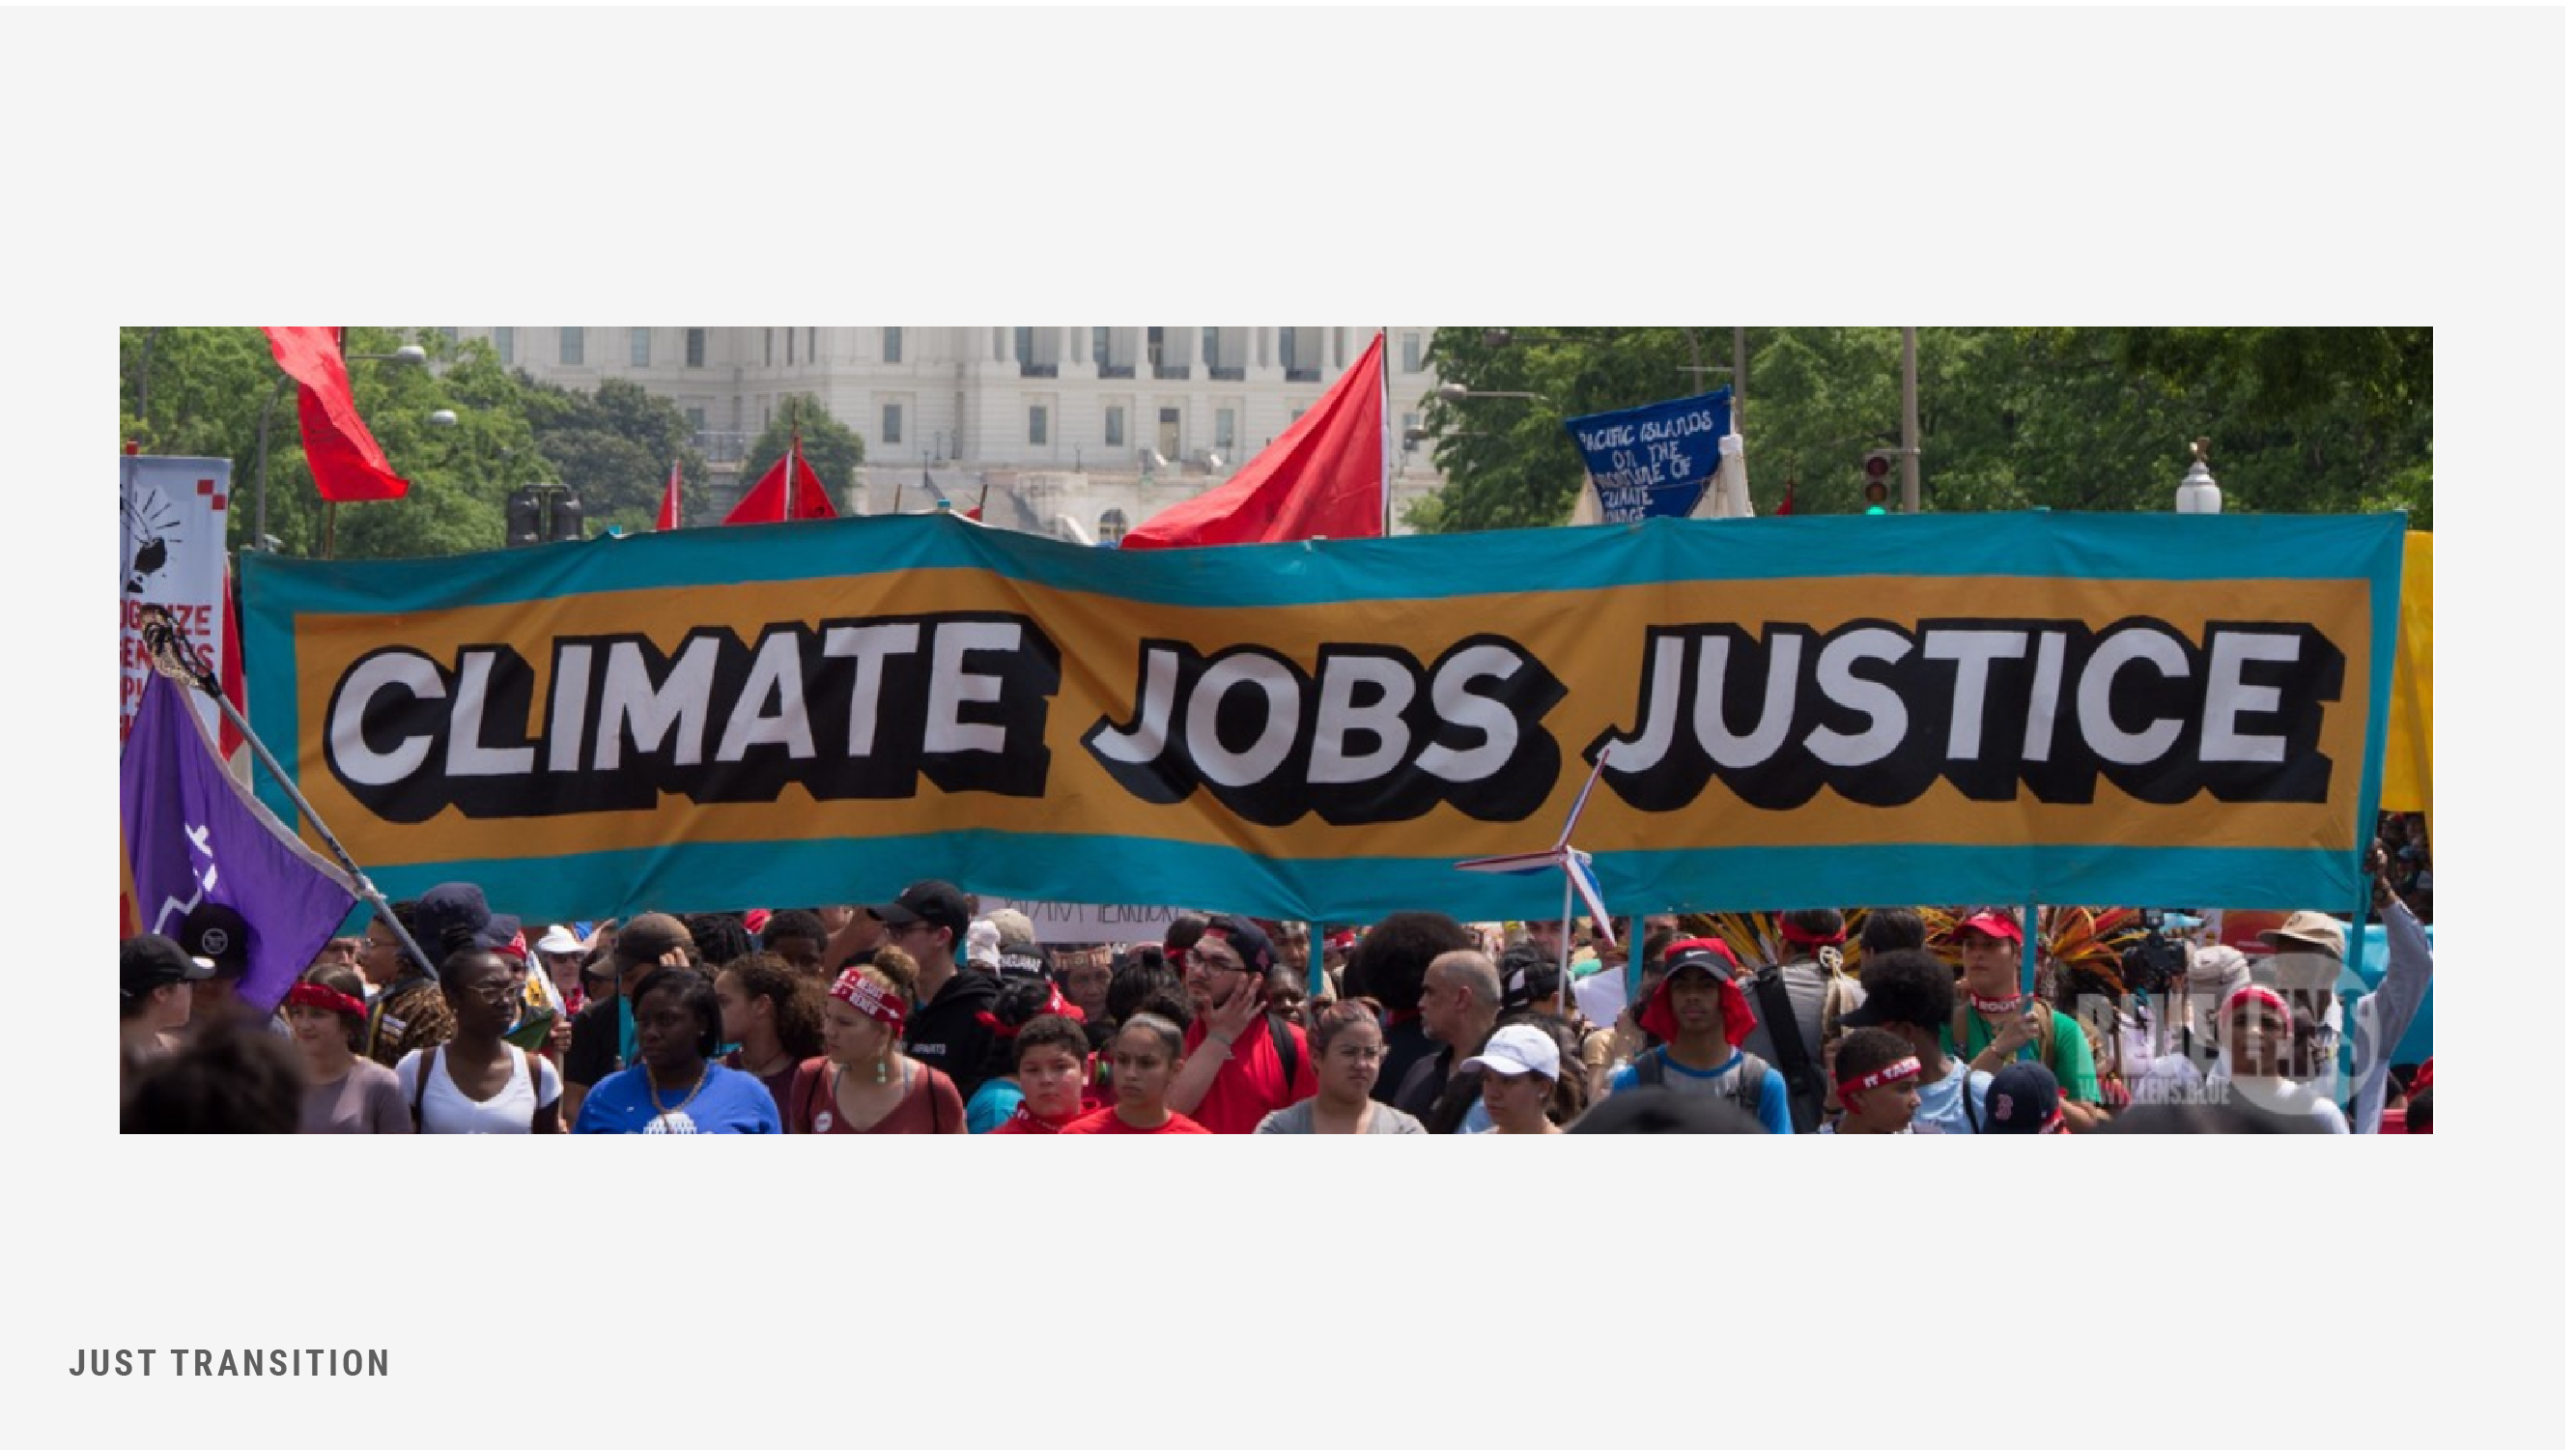

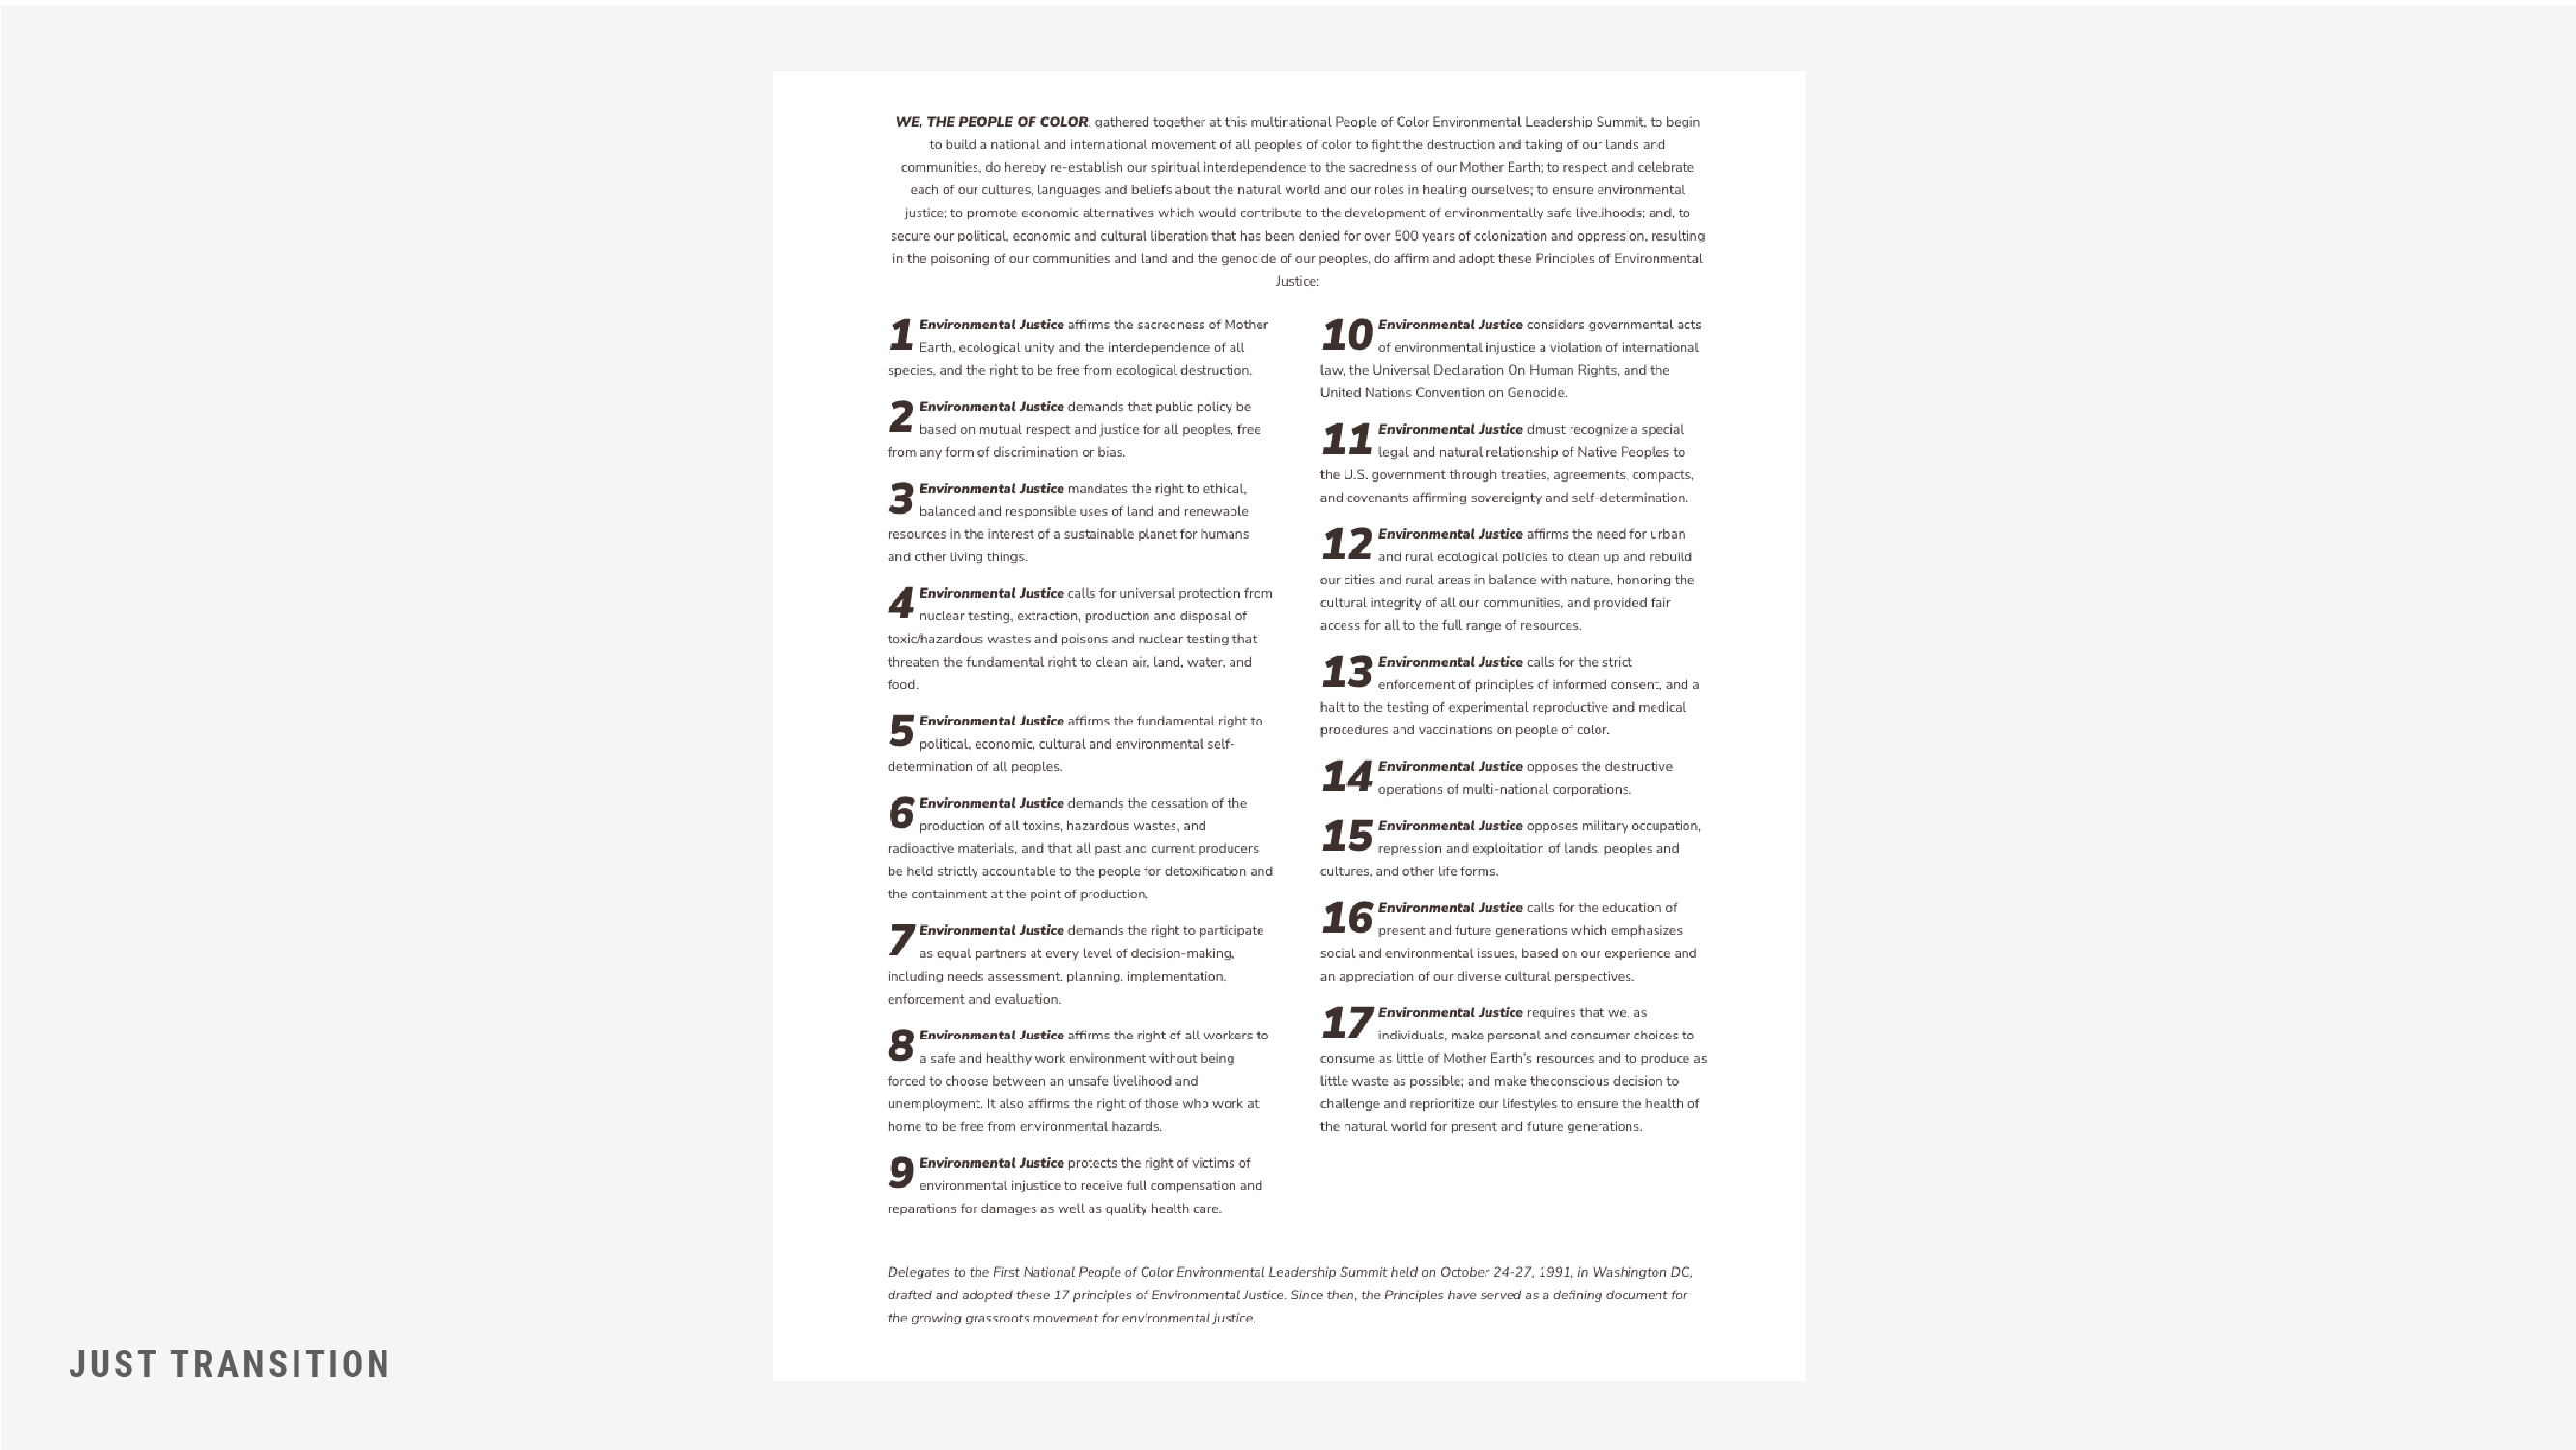

Put in the words of activists, the Climate Justice Alliance explains:
Just Transition is a vision-led, unifying and place-based set of principles, processes, and practices that build economic and political power to shift from an extractive economy to a regenerative economy. This means approaching production and consumption cycles holistically and waste-free. The transition itself must be just and equitable; redressing past harms and creating new relationships of power for the future through reparations. If the process of transition is not just, the outcome will never be. Just Transition describes both where we are going and how we get there.
SOURCES
Bruckner T., I.A. Bashmakov, Y. Mulugetta, H. Chum, A. de la Vega Navarro, J. Edmonds, A. Faaij, B. Fungtammasan, A. Garg, E. Hertwich, D. Honnery, D. Infield, M. Kainuma, S. Khennas, S. Kim, H.B. Nimir, K. Riahi, N. Strachan, R. Wiser, and X. Zhang, 2014: Energy Systems. In: Climate Change 2014: Mitigation of Climate Change. Contribution of Working Group III to the Fifth Assessment Report of the Intergovernmental Panel on Climate Change [Edenhofer, O., R. Pichs-Madruga, Y. Sokona, E. Farahani, S. Kadner, K. Seyboth, A. Adler, I. Baum, S. Brunner, P. Eickemeier, B. Kriemann, J. Savolainen, S. Schlömer, C. von Stechow, T. Zwickel and J.C. Minx (eds.)]. Cambridge University Press, Cambridge, United Kingdom and New York, NY, USA. https://www.ipcc.ch/site/assets/uploads/2018/02/ipcc_wg3_ar5_chapter7.pdf
Clean Energy guest writer. “Study Proves Fossil Fuels Way Worse for Land Use than Renewables.” Clean Energy. 2015. https://cleanenergy.org/blog/renewablelanduse/
Climate Justice Alliance. https://climatejusticealliance.org/
Copenhagen Environment and Energy Office. The Middelgrunden Offshore Wind Farm: A Popular Initiative. Copenhagen: Copenhagen Environment and Energy Office, 2003. https://base.socioeco.org/docs/a118_doc1.pdf
https://www.middelgrunden.dk/
http://www.hnsland.nl/en/projects/landscape-energy
Doan, Lynn, Brian Eckhouse, Christopher Cannon and Hannah Recht. “What’s Behind the World’s Biggest Climate Victory? Capitalism.” Bloomberg. September 15, 2019. https://www.bloomberg.com/graphics/2019-can-renewable-energy-power-the-world/
Energypedia. “Hydro Power Basics.” https://energypedia.info/wiki/Hydro_Power_Basics
Freeing Energy. “How much land does hydropower require to generate a megawatt hour?” Freeing Energy online source. https://www.freeingenergy.com/math/hydro-land-acres-hectares-miles-m124/
Grimwood, Mariah. “Tidal Energy Pros & Cons (Advantages & Disadvantages): What Is The Future Of Tidal Power?” ECAVO. https://ecavo.com/tidal-energy/
Lewis, M., S.P.Neill, P.E.Robins, M.R.Hashemi. “Resource assessment for future generations of tidal-stream energy arrays.” Energy, Volume 83. 2015: p 403-415. https://www.sciencedirect.com/science/article/pii/S0360544215001930
National Geographic. “Geothermal Energy.” https://www.nationalgeographic.org/encyclopedia/geothermal-energy/
NYSERDA. “Wind Energy Basics.” In New York Wind Energy Guide for Local Decision Makers. https://www.nyserda.ny.gov/-/media/Files/Publications/Research/Biomass-Solar-Wind/NY-Wind-Energy-Guide-1.pdf
Sijmons, Dirk, Jasper. Hugtenburg, Anton van. Hoorn, and Fred Feddes. Landscape and Energy : Designing Transition. Rotterdam: nai010: 2014.
Sørensen, Hans Christian, et al. MIDDELGRUNDEN 40 MW OFFSHORE WIND FARM DENMARK - LESSONS LEARNED. Copenhagen Environment and Energy Office (CEEO). 2002.
StackExchange. “How much irradiation from the sun is required to generate solar power?” Sustainable Living. https://sustainability.stackexchange.com/questions/5708/how-much-irradiation-from-the-sun-is-required-to-generate-solar-power
Szumilas-Kowalczyk, Hanna K. and Pevzner, Nicholas, "Getting Beyond Visual Impact: Designing
Renewable Energy as a Positive Landscape Addition" (2019). Visual Resource Stewardship Conference. 11. https://digitalcommons.esf.edu/vrconference/11
WindPRO tool: http://www.petus.eu.com/left.php?sct=1&sbsct=2&pageid=170&pagesect=0&pagelang=en
Smil, Vaclav. “What I See When I See a Wind Turbine.” IEEE Spectrum 53, no. 3 (2016): 27.
Soltis, Chloe. The Ecological Pulse of Electric Flows: Enriching Georgia’s Solar Landscape. Master in Landscape Architecture Thesis. Cambridge: Harvard University Graduate School of Design, 2021.
State of Green. https://stateofgreen.com/en/
Tilghman, Matt. Finite Biomass Capacity Limits. Stanford University. 2011. http://large.stanford.edu/courses/2011/ph240/tilghman2/
UN Environment Programme, Emissions Gap Report, 2021. https://www.unep.org/resources/emissions-gap-report-2021
US Energy Information Administration. EIA website. https://www.eia.gov/